Have Stocks Reached a Permanently High Plateau?
Membership required
Membership is now required to use this feature. To learn more:
View Membership Benefits The views presented here do not necessarily represent those of Advisor Perspectives.
You may recognize the title of this article as a quote from Irving Fisher, an American economist who enjoyed Keynes-level prominence during the 1920s. He made this remark on October 15, 1929.
Have we reached our Fisher moment, here in 2026, as October progresses? Popular opinion appears divided.
On one hand, there’s been no shortage of bubble talk and fears that stocks are teeter-tottering at nosebleed levels. See, for example, here and here.
On the other hand, there’s no shortage of exhortations that stocks are absolutely, positively the best investment to hold over any longish horizon. A famous recent example is a paper showing that an all-stock portfolio, for all of life, was hands down the best investment strategy over the life cycle, not just for young people during accumulation, but also for oldsters in retirement. In other words: Diversification with bonds is for dummies.
Is it time to bail out of stocks — or to stay the course?
Who knows? It will take decades before we can judge whether fall 2026 was a terrific time to invest in stocks, or one of the all-time great opportunities to sell and get out with your riches intact.
In the meantime, we can array recent stock returns against history to put 2026 into context and allow readers to judge for themselves.
* * *
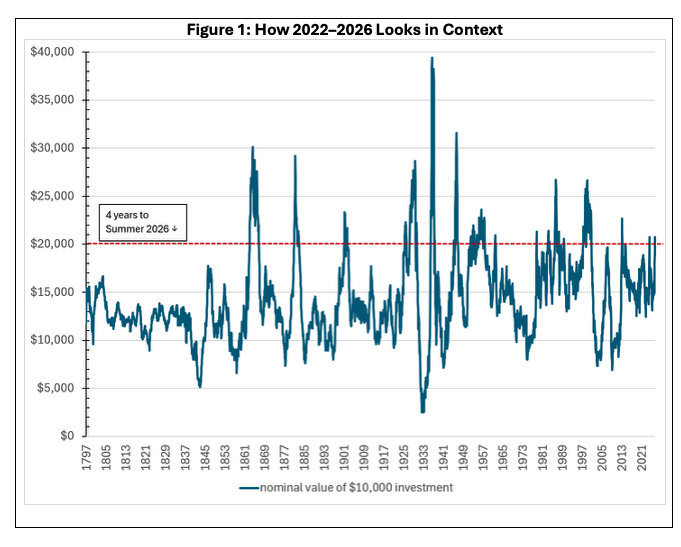
Figure 1 shows the results for 48-month rolls in the U.S. market since 1792.
Why four-year rolls? Because stocks most recently bottomed in early fall 2022, followed by a nearly uninterrupted doubling. Question:
How common is it for stocks to double in four years coming off a low?
Answer:
It happens all the time, with over a dozen instances since the first such during the Civil War. No biggie. Not even close.
To see what maximum four-year performance for stocks looks like, you need a much deeper low than was recorded after that piddling 2022 decline. The granddaddy of all was the post-1932 bounce, where investors quadrupled their wealth in four short years. Another big jump occurred in the Roaring Twenties, which saw a three-bagger off the post–World War I low.
Figure 1 also puts paid to the perennial prattle about how stocks have become more volatile: Compared to the pre-1940 period, they’ve recently been the lazy river leading into the Marriott pool. Doubling in four years is just what stocks do when they are in the mood. All it takes is a good punch in the face beforehand, like the 18% drop in 2022.
Yessir, you in the back, what’s your question? “Hey, I’m not concerned about the bounce off the 2022 low. I worry that the rise following the 2009 bear market low has tapped out, the roller coaster is near its crest, and a big, big drop is looming.”
We get it: You want to see 17.5-year rolls, to put the rise from March 2009 in historical perspective. The Global Financial Crisis did indeed mark a major bottom, the final unwinding of the 1982–1999 super bull market. The entire Lost Decade from 2000–2009 was pretty grim, the yin to the yang of the high that followed the end of the Cold War and culminated in the dot-com boom.
Right, then: Here are 17.5-year rolls, the first one completed in July 1810. Of course, over this longer term we must adjust for inflation. Inflation of 4% almost doubles prices over 17 years. Figure 2 shows real stock market returns over the trailing 210 months. The greatest surge of all over a 17.5-year span was in fact that 1982–1999 super bull. If stocks are going to match that upswing, albeit over a longer interval, there’s no bubble here in 2026 — we’ve only climbed the foothill of the rise to come, booking a mere 7X of the 11X wealth multiplication that may be on offer. Stay the course!
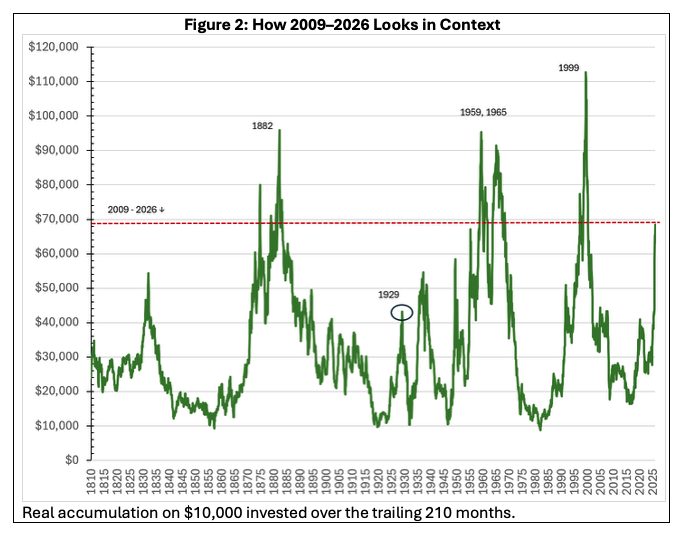
The other two cases that considerably exceeded 2009 – 2026 are the post–Civil War bull and the great post–World War II rise. You can’t call it a bubble in 2026 if one of those templates will ultimately shape our fate.
Next, note the small peak in Figure 2 labeled “1929.” Everyone knows that viewed in a two-century context, 1929 was a great blow-off peak in the stock market — but not when viewed over a 17.5-year time frame. There had been no epochal low in 1912 (17.5 years before fall 1929) to match that of 2009 — or 1982.
The takeaway: For assessing the state of play in 2026, neither 48-month nor 210-month rolls quite deliver the goods. What matters is not performance over some fixed interval, but how far the stock market can rise off a major bottom, and for how long.
Let’s focus on where we are relative to 2009’s major bottom. Are we swaying at the top of a cliff, or still toiling up a foothill? To answer that, we need to see how high stocks rose after each of the major bottoms over the past two centuries. In other words, how far did the stampeding bull get, and how long did it take, before he became the cartoon roadrunner looking down past the edge of the cliff?
Put bluntly: A change of perspective is required relative to the typical market history you may have seen. Let’s suppose for a moment that the long-term average return on U.S. stocks — 10% nominal, or 7% real — is not very informative about what will happen next. Rather, let stocks always be in one of two states: declining or advancing. We need to see what kind of returns are possible during a long advance if we are to assess our situation post-2009. Mixing together historical advances and declines and taking an average just gives mush — not guidance.
Figure 3 shows some of the great, miserable bottoms in U.S. market history and the subsequent recoveries. We’ve dated the end points of the four most recent moves and called out 2009–2026 as a black dashed line.
If you have long been a student of markets, be sure to read the boxed caveats that follow the chart. If not, you can approach the chart with a blank slate. Focus on the black dashed line: What do you see?
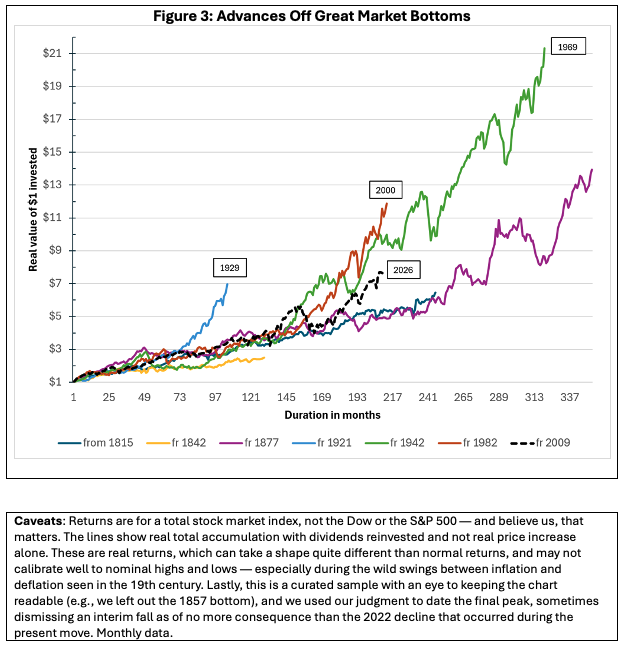
A first takeaway would be: There’s nothing special about 2009 – 2026 to this point. It’s not the longest run, nor has it achieved the highest rise. There are two truly exceptional cases. First, the post–WW II move, beginning in 1942, which lasted almost 27 years and multiplied wealth by over 20X. If that’s our future here in October 2026, sit back and enjoy the ride — it’s stocks for the long run!
The second outstanding exception is 1921 – 1929. That’s what a real blow-off looks like — a true bubble, 7X the wealth in just eight short years. We’ve seen nothing like it before or since.
True, the 1982 – 1999 rise topped out after 17+ years, which we can take as a warning that the 2009–2026 bull is getting long in the tooth. However, if the current move is ultimately going to achieve that same 11X wealth multiplication, albeit at a slower pace, it’s again time to freshen your popcorn, sit back, and enjoy the show.
One final point, focusing now on the two longest runs: The great post–Civil War move beginning after the Panic of 1873 ran its course (magenta) and the great post–WW II run (green). It’s now early October. Imagine that by later this month the stock market happens to have fallen 8%, maybe 12% from today’s levels. This historically fraught month looms like a shadow in a slasher flick; references to 1929 are everywhere. What to do?
The historical data in Figure 3 show that corrections come with the territory during a multi-decade bull run. There’s no signal to be had from a 10% – 15% decline, any more than 2022 signaled the end of the post-2009 run. Things looked bad in 1893 and 1903, during the post–Civil War run-up. Likewise, long after WW II, there were notable declines in 1962 and 1966. But in each case, the top was still years ahead.
Next, we need to know what can happen if you go on a restroom break just before they ring the bell to signal a top, causing you to join the roadrunner out there in the thin air.
Figure 4 shows the peak-to-trough decline following the topping out of each move in Figure 3, again in real terms. Typically, the drawdown has been on the order of 50% real, although it has been as shallow as 37%, and once — only once — as deep as 80%. Poor Professor Fisher.
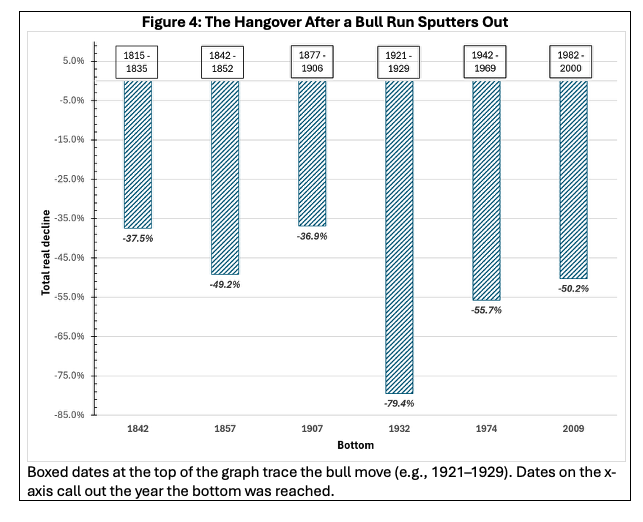
Long story short: If you could detect a market top, it would be well worth your while to take action, lest you see your wealth cut in half. But that, as everyone knows, is the mother of all “ifs.”
Conclusion
There’s no smoking gun in the historical data. Same as it ever was: We could be nearing the top here in 2026, or the top could be years away, with much further wealth gain yet to come.
Beats us. Unlike many on Wall Street, neither of us got a degree from Clairvoyant University.
The important thing — the key to coming to a reasoned evaluation — is to understand the math of declines and advances. Because stocks are on track to have gone up by 20% per year for four years in a row since 2022, and because everyone knows that the long-term return on stocks is barely in the double digits, at 10%, it is natural to go full Cassandra: This cannot continue!
Now, take out your phone and enter 0.50 in your calculator — in other words, put yourself at the bottom of one of the fearsome market declines chronicled in Figure 4. Multiply by 1.2 four times to simulate four years of hefty rises — as in 2022–2026.
Congratulations — you just broke even. Want to get back to a run rate of 10% annualized, including that 50% drop and those four rallies of 20%? No problem: Just add five more 20% rallies.[1]
Remember this little exercise. After a punch to the jaw, stocks can go up and up, the more so if investors spit out teeth.
Will stocks continue their rise from here? There’s no reason why they can’t, just because they’ve been going up at 20% per year for several years. Of course, there’s equally no compelling reason they should continue in that vein.
Stock movements are difficult to predict, as the hapless Irving Fisher discovered. His $10 million portfolio — $200 million in today’s dollars, pretty good for an academic — was wiped out. He had to sell his beloved home near Yale because he couldn’t afford the payments. . . . For the rest of his life, he survived off personal loans from his sister-in-law, loans that he could never pay back.[2]
At least he married well.
* * *
Is the market cruising for a bruising here in fall 2026? We’ve shown you the history. Now it’s your call.
Endnotes:
1 If you’ve still got your phone in hand: Confirm by taking the 10th root of (0.5 * 1.29 ).
2 Moshe A. Milevsky, “The 7 Most Important Equations for Your Retirement,” John Wiley & Sons (2012), pp. 99, 79.
Edward F. McQuarrie, Ph.D., is professor emeritus at Santa Clara University. He writes about financial history and its implications for retirement planning. His paper, “The 4% Rule Was Never Failproof,” won the 2026 Journal Research award from the Investments & Wealth Institute. Working papers describing his research can be downloaded here.
William J. Bernstein is a neurologist, the co-founder of Efficient Frontier Advisors, an investment management firm, and a writer with several titles on finance and economic history. He has contributed to the peer-reviewed finance literature and has written for several national publications, including Money magazine and The Wall Street Journal. He has produced several finance titles, and four volumes of history, The Birth of Plenty, A Splendid Exchange, Masters of the Word, and The Delusions of Crowds about, respectively, the economic growth inflection of the early 19th century, the history of world trade, the effects of access to technology on human relations and politics, and financial and religious mass manias. He was also the 2017 winner of the James R. Vertin Award from the CFA Institute.
A message from Advisor Perspectives and VettaFi: Discover something new! Click here to register for our upcoming webcasts.
Read more articles by Edward F. McQuarrie, William J. Bernstein
Membership required
Membership is now required to use this feature. To learn more:
View Membership BenefitsSponsored Content
Upcoming Virtual Events View All