Advisor Perspectives welcomes guest contributions. The views presented here do not necessarily represent those of Advisor Perspectives.
Investors in large capitalization indexes now face historically elevated concentration, demanding valuations, and growing influence by leveraged/volatile investment products. In our view, these developments have shifted the relative risk-reward balance toward small-capitalization stocks.
Small-capitalization stocks may now provide greater diversification and less valuation risk than many of the market’s largest blue-chip companies. Moreover, it appears to us that this is just the beginning stages of a change in leadership, and it is possible small-capitalization stocks could outperform large stocks for the next few years.
Volatility Is the Dark Side of Leverage
The increasing use of leveraged and inverse exchange traded funds (ETFs) brings to mind a warning often attributed to Charlie Munger: “There are only three ways a smart person can go broke: liquor, ladies, and leverage.” Munger’s reasoning needs a gender refresh, but the warning about leverage does not.
Industry estimates suggest that U.S.-listed leveraged and inverse ETFs recently held approximately $200 billion in assets, representing close to $500 billion of gross market exposure.¹ That estimate does not include leverage employed through margin accounts, options, futures, and other trading vehicles.
Leveraged and inverse ETFs generally reset their targeted exposure each day. As markets move, the funds must rebalance their portfolios while derivatives’ counterparties may also need to adjust their hedges. During periods of heightened volatility, these transactions can produce procyclical flows that amplify market movements. This risk is potentially more significant today because the 10 largest companies account for close to 40% of the S&P 500. Investors who believe they own a broadly diversified index are therefore unusually dependent on a relatively small group of highly valued companies.
We are not predicting a dire outcome for large-capitalization stocks nor are we suggesting that leveraged ETFs determine the direction of the market. Rather, we believe the combination of concentration, elevated valuations, and leverage makes the largest stocks inherently less defensive than they appear. Meanwhile, small-capitalization stocks remain generally under-owned and inexpensive relative to their large-capitalization peers, creating what we believe is a distinctive and attractive risk/reward opportunity.
Growing Concentration
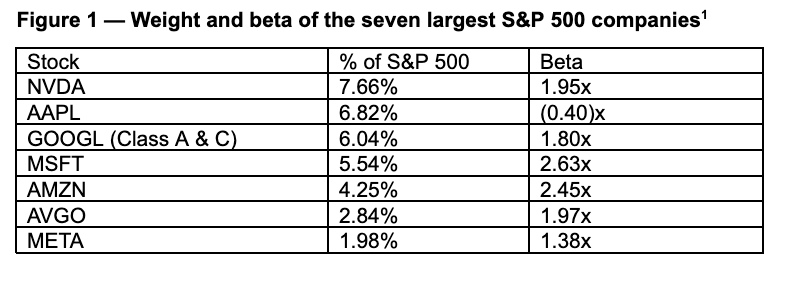
Most investors recognize that the U.S. stock market has become increasingly concentrated. The seven largest companies represent approximately 35% of the S&P 500. Concentration alone does not necessarily create an imminent risk (many foreign stock markets are even more concentrated than the United States and have done just fine). Our greater concern is how concentration interacts with leverage, elevated valuations, and increasingly short-term trading activity. It is worth noting that the presumed inclusion of SpaceX (SPCX) and a potential Anthropic IPO would exacerbate the concentration issue in the S&P 500.
The seven largest S&P 500 companies are not merely large. Several have also exhibited considerable sensitivity to market movements. When these stocks dominate the index, their volatility can increasingly become the market’s volatility. Aside from the countercyclical Apple (AAPL), the average beta of the six largest stocks is over twice that of the overall market.
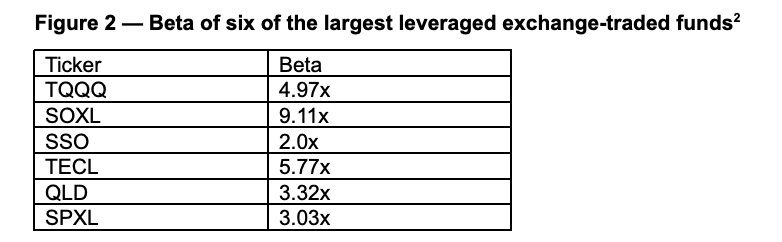
Leveraged ETFs add another layer of market sensitivity. Their stated objective is to deliver a multiple of an index’s daily return. Still, their realized beta can be even higher depending on the underlying index, measurement period, and market environment. The average beta of the six largest leveraged ETFs is 4.7x that of the market.
By comparison, recent beta measurements for broad small-capitalization and for small-capitalization value indexes have been substantially lower.
Leveraged ETFs’ Volume Traded Is a Red Flag
Another concern is the extraordinary amount of money traded each day in the seven largest companies and the largest leveraged ETFs.² The seven largest S&P 500 stocks collectively trade approximately $110 billion per day. The six leveraged ETFs shown in the original commentary trade another $12 billion per day.
These funds’ use of derivatives, daily rebalancing, and counterparty hedging can transmit additional buying and selling pressure to their underlying securities — particularly during large market moves. Therefore, the concern is not simply how many leveraged ETF shares change hands, but how the funds and their counterparties must respond as prices and assets under management change.
By comparison, the iShares Russell 2000 ETF (IWM) trades approximately $8.1 billion per day, while the iShares Russell 2000 Value (IWN) trades only about $174 million. The fact that six leveraged ETFs collectively generate more daily turnover than IWM does not, by itself, establish that the market is unstable.
It does, however, illustrate how heavily trading activity has become concentrated around large-capitalization, technology, and leveraged investment products. Therefore, the large-capitalization market increasingly displays some of the speculative, short-term characteristics historically associated with small-capitalization stocks.
Small-Capitalization Stocks Currently Offer the Best Long-Term Risk/Reward
For years, conventional financial planning models allocated the bulk of investors’ equity portfolios to large-capitalization stocks. Small-capitalization stocks were generally viewed as a higher risk, more volatile asset class that should represent only a limited portion of a portfolio. Unless investors were young, had an unusually high tolerance for risk, or possessed sufficient assets to withstand substantial volatility, small-capitalization stocks were often treated as highly speculative investments.
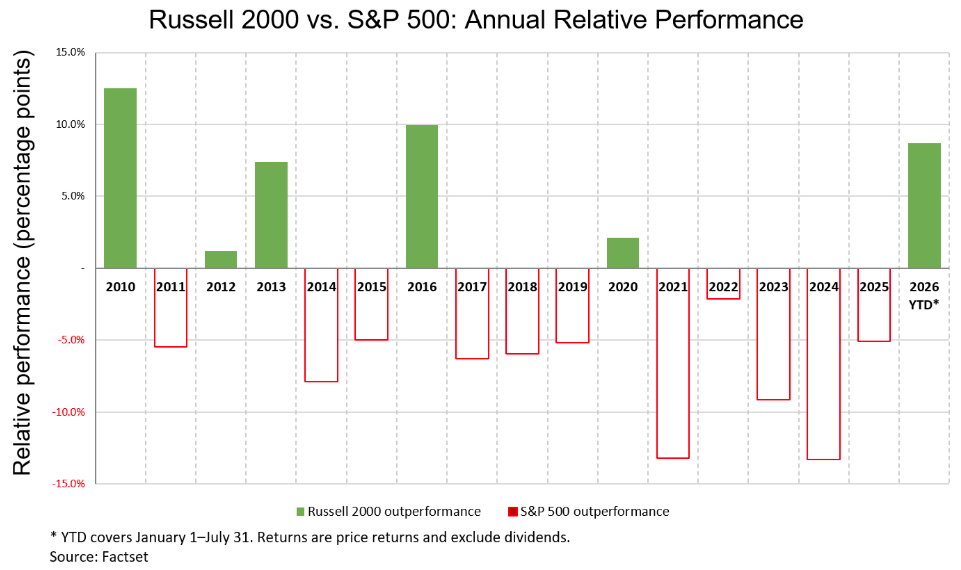
The period after the Great Financial Crisis illustrates how dramatically assumptions can change.³ From 2010 through 2013, the interplay between small- and large-capitalization stocks closely resembled the traditional market pattern: Small-capitalization stocks tended to underperform during flat or declining markets but often outperformed when economic conditions and investor risk appetites improved.
That relationship changed after 2014. The S&P 500 materially outperformed the Russell 2000 in nine of the following 12 years. The Russell 2000 materially outperformed in only one year, while the two indexes generated roughly comparable returns in just two years.
A Distorted Cycle
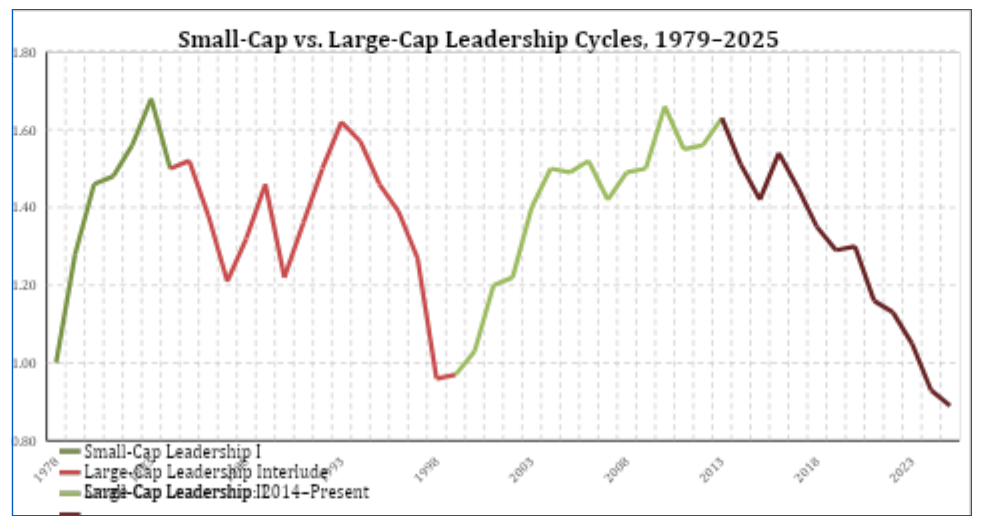
Taking a longer-term, broader view, such one-sided performance could be considered normal, but it is not sustainable. The relative performance between small-capitalization and large-capitalization stocks tends to move in cycles, but the current large-capitalization cycle is overextended, in our opinion. The last time the small-capitalization segment outperformed, on a relative basis, was from 2000 to 2010, when the Russell 2000 outperformed the S&P 500 by nearly 500 bps, annualized.⁴
Small-capitalization stocks led in the late 1970s and early 1980s as investors sought out the flexibility of smaller businesses and companies. Large stocks led from the mid-1980s through the late 1990s as new-era technology and growth companies outperformed leading up to the dot-com bust. Small stocks led again from 2000 to 2013; this period included the post-bubble recovery, the 2003–2007 economic expansion, and the Great Financial Crisis recovery.
Since 2013, the ratio has been in a sustained downtrend (implying large stocks outperformed), falling from 1.63 in 2013 to 0.89 by 2025 — the lowest reading in the entire data set. This marks the most pronounced and extended period of large-stock dominance on record, driven primarily by returns in a handful of megacap technology stocks. By 2024 and 2025, small stocks were trailing large stocks on a cumulative basis by the widest margin observed since data inception.
This Is Not a One-Year Market Cycle
After a prolonged period of underperformance, small-capitalization stocks have regained the lead so far in 2026. One of the most frequent questions we receive is whether investors have already missed the move in small-capitalization stocks. To borrow Lee Corso’s familiar phrase: “Not so fast, my friend.”
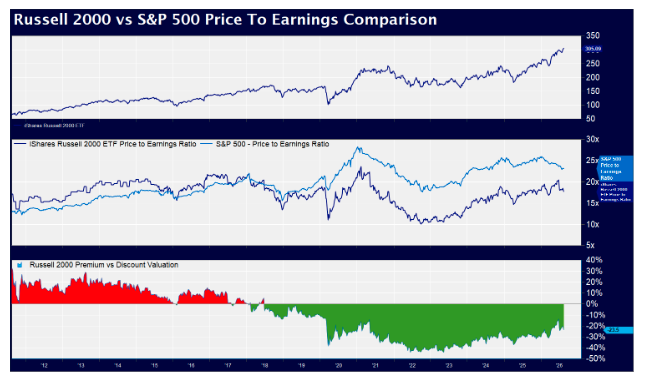
Although some small-capitalization companies have benefited from enthusiasm surrounding artificial intelligence, we continue to find attractive opportunities across the financial, healthcare, technology, industrial, and energy sectors. More importantly, many of these businesses are profitable and growing, yet still trade at reasonable valuations. Even after the Russell 2000 outperformance this year, the forward price-to-earnings ratio is still more than 20% below that of the S&P 500.⁵
If market leadership broadens and investors again place greater emphasis on value or growth at a reasonable price, we believe small-capitalization stocks can return to favor. We are not even through the first year of what could become a multiyear shift in market leadership. After more than a decade in which large-capitalization stocks enjoyed nearly uninterrupted valuation expansion and investor attention, it would be premature to assume that the small stocks’ relative recovery has already run its course.
Disclosure
This commentary is limited to the dissemination of information pertaining to Pinnacle Associates, Ltd. (“Pinnacle”) and general economic market conditions and is an example of Pinnacle’s Small/Mid Cap Equity investment process. It should not be construed as a recommendation, personalized advice, or an offer or solicitation to buy or sell any securities. Past performance is not indicative of future results, and there is no guarantee that the views and opinions expressed will come to pass. Pinnacle is neither a law firm nor an accounting firm, and no portion of this commentary should be construed as legal or tax advice. You are advised to consult with separate legal or tax advisors with respect to any legal or tax advice. Pinnacle is an investment adviser registered with the SEC. For information pertaining to the registration status of Pinnacle, please refer to the Investment Adviser Public Disclosure website (adviserinfo.sec.gov). For additional information about Pinnacle, including fees and services, send for our written disclosure statement as set forth on Form ADV Part 2A.
Endnotes
1 Danielle Liverance, “‘An Absolute Casino.’ The $500 Billion Leveraged ETF Craze Proving Buffett Right,” Yahoo Finance, July 13, 2026.
2 FactSet
3 FactSet
4 Source: FactSet — Russell 2000 & S&P 500 Gross Total Return Index Levels, USD, Unhedged. Note: S&P 500 total return data is available from 1988 onward; 1979–1988 ratios are based on price return index levels only. The 1.00 line represents cumulative parity between the two indexes.
5 FactSet
George Pickral, Jack Bocock, and Thomas Neuhaus are portfolio managers at Pinnacle Associates.
A message from Advisor Perspectives and VettaFi: Discover something new! Click here to register for our upcoming webcasts.
Read more articles by George Pickral, Jack Bocock, Thomas Neuhaus
 Advisor Perspectives welcomes guest contributions. The views presented here do not necessarily represent those of Advisor Perspectives.