VOLATILITY RETURNS TO EQUITY MARKETS AS FED KICKS RATE HIKE DOWN THE ROAD
The S&P 1500 capped its fourth consecutive quarter of positive returns (and its 26th out of the last 30), as volatility reverted back up, closer to historical levels.
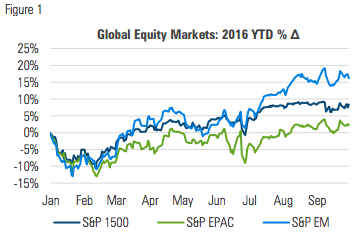
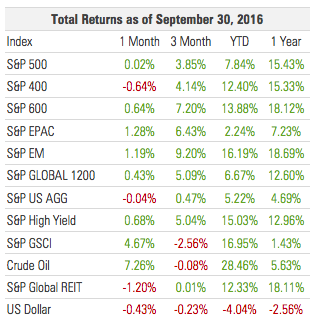
U.S. EQUITY MARKETS FINISHED SEPTEMBER FLAT WHILE INTERNATIONAL MARKETS EXTENDED THEIR YTD GAINS
International developed markets led global equities, finishing the month 1.3% higher. Emerging market equities followed closely behind, notching their best quarterly return since Q1 2012:
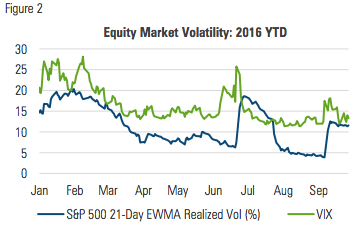
After an unusually calm August, equity markets grew increasingly volatile in September as investors awaited a rate decision from the Fed:
MANAGED RISK PORTFOLIOS
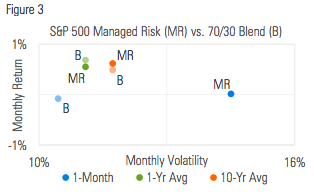
The S&P 500 Managed Risk Index (which has a 0% bond allocation and volatility target of 18%) maintained a 100% equity allocation throughout the entire month of September, just as it did in August. Volatility was so low heading into September that even after it increased more than two-fold, it was still not high enough to trigger a reduction in the index’s equity allocation.
The return of S&P 500 Managed Risk Index matched that of the S&P 500, and marginally outperformed a 70/30 stock/bond blend:
One of the defining characteristics of a managed risk approach is its focus on reducing a portfolio’s participation in down markets. This is carried out by dynamically adjusting a portfolio’s equity exposure in an effort to control a portfolio’s overall volatility. The principle behind this is that the highest levels of volatility tend to be associated with the biggest drawdowns.
From January 1928 through September 2016, the price level of the S&P 500 climbed at an annualized rate of 5.6%, for a total increase of 12,178%. Over that 88-year time-span there were 22,272 21-day periods. Figure 4 depicts the volatility of each of those 21-day periods against its corresponding return:
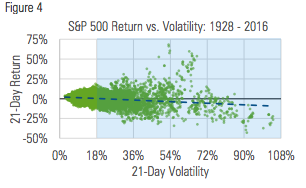
Figure 5 offers cross-sectional details about the returns, dividing them into four categories of return and volatility:
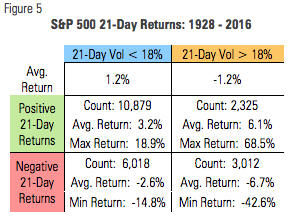
By seeking to participate less when markets exhibit higher volatility, a managed risk approach limits a portfolio’s exposure to the relationship between high volatility and negative returns. Whether insurance companies, pensions, endowments or individual retirees, a managed risk approach offers a sensible philosophy of equity exposure for investors who rely on their investments to fund their liabilities.
MARKET COMMENTARY
After being down by as much as 2% in the first half of the month, the S&P 500 gradually dug its way out, finishing September in positive territory, albeit by the skin of its teeth:
The S&P 500 was negative for the month heading into the last day of September; having been spooked by questions about Deutsche Bank’s fiscal health, the S&P 500 sold off on the 29th , only to recover on the 30th and notch its seventh consecutive month of non-negative returns. Much of the concern surrounding DB is in response to the $14 billion MBS-related fine that the U.S. Department of Justice assessed on DB. Coincidentally, this came right on the heels of the EU filing suit against Apple for $14.5 billion in back taxes.
Emerging market equities are up more than 16% through the first three quarters of 2016 and are having their best year since 2009. International developed equities have failed to keep pace YTD, but had their best quarterly return since 2013.
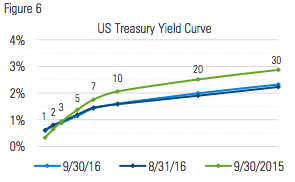
The U.S. yield curve was essentially unchanged in September. The short end now sits higher than it did a year ago, while the long end remains well below:
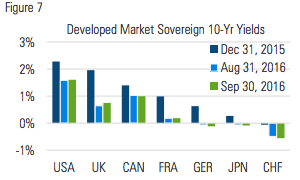
In the UK, rates edged higher, while in Germany, Japan and Switzerland they moved deeper into negative territory, as the ECB announced its intention to maintain its high level of ongoing policy accommodation and the BOJ announced it would target a yield of 0% on its 10-year bond.
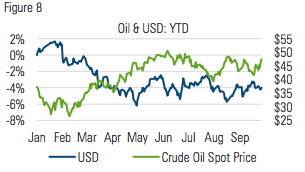
The price of oil rose more than 7% for the second month in a row effectively erasing the 13.5% decline in July, as the cartel of OPEC announced an agreement to cut their oil production. The U.S. dollar was volatile during the month, ultimately finishing 0.43% lower:
THE FED AND THE FATE OF THE YIELD CURVE
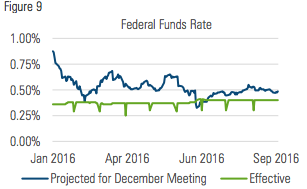
Investors headed into September facing the legitimate prospect of a Fed rate hike later in the month. The Fed ended up holding off, but paved the way to make an increase before year end, stating that, “job gains have been solid… [and] the case for an increase in the federal funds rate has strengthened.”
As of the end of September, the futures market for fed funds was indicating a 51% probability that the Fed would initiate one increase before year end.
Nevertheless, the Fed remains caught between a rock and a hard place. On the one hand, it understandably wants to normalize policy by increasing the fed funds rate. On the other hand, the growth and inflation data it relies on have remained stubbornly low. Moreover, the ECB and Bank of Japan remain extremely accommodative, which continues to put upward pressure on the dollar even in the absence of Fed tightening.
As indicated in figure 6, the short end of the curve has risen over the past year as the Fed carried out its first hike and has made the ongoing case for future hikes. Yet as the front end has risen, the long end has fallen.
One way to interpret this is that investors are less optimistic about a future under tighter monetary conditions, and the diminished optimism is manifesting itself in the form of both lower yields and a flatter yield curve.
As indicated in figure 10, over the last 25 years, the yield on the 10-year Treasury has gradually declined on a path similar to the decline in GDP growth:
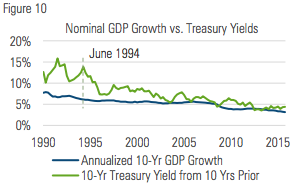
Coming out of the high-inflation 1980s, the 10-year yield, while often getting the direction right, was not a particularly reliable indicator of the actual level of future nominal growth. For example, through the end of June 1994, the economy had grown at an annualized nominal rate of 6.1% during the previous 10 years, falling short of the 13.8% 10-year Treasury yield from June 1984. More recently, as inflation has declined and become less variable, the 10-year yield has been a more accurate predictor of future growth. If today’s yields are any indication, the U.S. is in for several more years of lower-than-average growth.
The slope of the yield curve also seems to offer hints of what future growth might look like. In figure 11, the trailing two-year GDP growth rate is compared to the rolling 90-day average slope of the yield curve from two years prior. By this metric, a flattening curve suggests that growth may not accelerate any time soon:
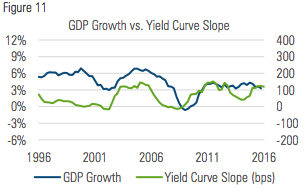
Today, the steepness of the U.S yield curve is still well off its 25- year low from the inversion in early 2000. Nevertheless, it is on a flattening trend that is well into its third year. The Fed’s first postcrisis rate hike and talk of a second have offered hints about how the curve might be expected to respond to subsequent hikes in the future, and by extension how the economy might be expected to perform.
As the Fed seeks to extract itself from its precarious position, economic growth may continue to be sporadic and hard to come by. In an environment like that, financial markets may well be expected to exhibit higher volatility as they reflect the contours of weakness in a struggling economy.

Milliman Financial Risk Management LLC is a global leader in financial risk management to the retirement savings industry. Milliman FRM provides investment advisory, hedging, and consulting services on over $166 billion in global assets (as of June 30, 2016).
Established in 1998, the practice includes professionals operating from three trading platforms around the world (Chicago, London, and Sydney).
Milliman is among the world's largest providers of actuarial and related products and services. The firm has consulting practices in healthcare, property & casualty insurance, life insurance and financial services, and employee benefits. Founded in 1947, Milliman is an independent firm with offices in major cities around the globe.
For further information:
MILLIMAN.COM/FRM
Recipients must make their own independent decisions regarding any strategies or securities or financial instruments mentioned herein.
The products or services described or referenced herein may not be suitable or appropriate for the recipient. Many of the products and services described or referenced herein involve significant risks, and the recipient should not make any decision or enter into any transaction unless the recipient has fully understood all such risks and has independently determined that such decisions or transactions are appropriate for the recipient.
Any discussion of risks contained herein with respect to any product or service should not be considered a disclosure of all risks or a complete discussion of the risks involved.
The recipient should not construe any of the material contained herein as investment, hedging, trading, legal, regulatory, tax, accounting or other advice. The recipient should not act on any information in this document without consulting its investment, hedging, trading, legal, regulatory, tax, accounting and other advisors. The materials in this document represent the opinion of the authors and are not representative of the views of Milliman, Inc. Milliman does not certify the information, nor does it guarantee the accuracy and completeness of such information. Use of such information is voluntary and should not be relied upon unless an independent review of its accuracy and completeness has been performed. Materials may not be reproduced without the express consent of Milliman.
MIL_COM_1 10/16_10/17 © 2016 Milliman Financial Risk Management LLC