If you think tracking error tells you how well a portfolio “tracks” the benchmark, it doesn’t. If you think it signals underperformance, that’s not right either. And if you believe high tracking error is inherently better or worse depending on the manager, that’s not the whole story.
Tracking error is widely cited in investing but frequently misunderstood. Here’s what it actually measures and what it can—and can’t—tell you about your portfolio.
Tracking error basics
Tracking error is the standard deviation of excess returns (portfolio return minus benchmark return), and standard deviation measures how wide the range of outcomes is relative to the average outcome. This is critical: Tracking error centers on a portfolio’s own average excess return; it doesn’t compare that average to anything else.
A lower standard deviation means outcomes cluster tightly around their own average, and a higher standard deviation means the outcomes are more dispersed around that average. Assuming a normal distribution, roughly 68%, 95% and 99.7% of outcomes fall within one, two or three standard deviations of the average, respectively.
Human height as a simple analogy
Imagine a town where people are 6 feet tall on average. If the standard deviation is 6 inches, we would expect most people to be between 5 and 7 feet tall. With a standard deviation of 3 inches, heights cluster more tightly between 5.5 and 6.5 feet.
Now consider a town where the average height is just 3 feet. Whether the standard deviation is 6 or 3 inches, we’d expect virtually no people to be 5 feet—let alone 7 feet! Standard deviation alone doesn’t tell the whole story—the average matters too.
Applying this to portfolios
Now extend this analogy to a portfolio’s returns. Remember, tracking error is the standard deviation of excess returns. If Portfolio A has higher tracking error than Portfolio B, Portfolio A’s excess returns are simply more dispersed relative to its own average excess return. It doesn’t tell you whether those excess returns were positive or negative, large or small, or better than Portfolio B’s.
Knowing only that a town’s height standard deviation is 6 inches doesn’t reveal whether residents are likely 7 feet tall. Likewise, tracking error alone doesn’t tell us whether a portfolio produces satisfactory returns for investors.
Let’s consider another example that may surprise you. Imagine a strategy that underperforms its benchmark by exactly 10% every year. This means its excess return is -10%, year after year after year. What is its tracking error?
Zero.
Despite extraordinary underperformance, this strategy has zero tracking error. Why? Because every outcome (-10%) exactly equals the average outcome (-10%), the excess returns don’t vary at all.
Standard deviation measures variability, not the average outcome, which is deeply negative. But tracking error reveals nothing about that.
How to use tracking error
When considering tracking error, it’s important to remember the average excess return. If a strategy has an average excess return of 0%, then tracking error tells us how a portfolio tends to perform versus its benchmark.
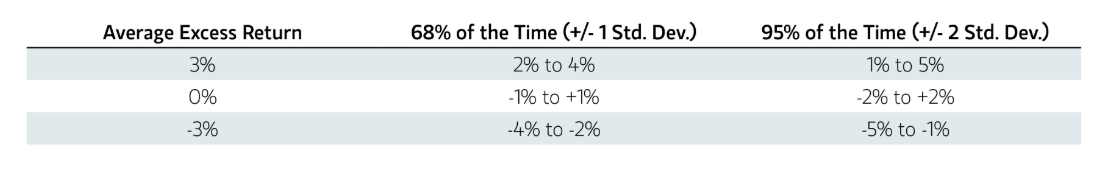
For a strategy with a tracking error of 1% and an average excess return of 0%, we’d expect excess returns between -1% and 1% two-thirds of the time, and between -2% and 2% about 95% of the time (assuming a normal distribution).
But if the average excess return is +3%, then the excess returns would be between 2% and 4%—not -1% and 1%— two-thirds of the time and between 1% and 5% about 95% of the time. If the average excess return is -3%, then expect excess returns to range from -4% to -2% two-thirds of the time and -5% to -1% about 95% of the time.

All three scenarios share a tracking error of 1%, yet the expected excess return ranges differ significantly based on the average—underscoring why we can’t assess tracking error in isolation.
If we had considered a tracking error of 3% in this illustration, instead of 1%, the difference becomes even more pronounced. In the case of an average excess return of -3%, and a tracking error of 3%, two-thirds of the time we’d expect relative returns between -6% and 0%—not -3% and +3%, which would be the case for an average excess return of 0% and a tracking error of 3%.
Ignoring average excess returns may be especially problematic during periods of sustained performance headwinds, which can produce far more extreme cumulative underperformance than an investor might have expected given tracking error alone.
The bottom line
Tracking error measures the consistency of excess returns around a portfolio’s own average excess return. Unless that average is zero, tracking error doesn’t reveal how the portfolio performs versus its benchmark, only how consistent it is relative to itself. Tracking error is directionally neutral—inherently signaling neither under- nor outperformance. And high or low tracking error isn’t good or bad on its own.
In alpha-seeking strategies, low tracking error can be good if excess returns tend to be consistently positive. And high tracking error can be acceptable if excess returns are positive more often than not. But to understand the direction and magnitude of excess returns, you need to know more than tracking error.
The views expressed in these posts are those of the authors and are current only through the date stated. These views are subject to change at any time based upon market or other conditions, and Parametric and its affiliates disclaim any responsibility to update such views. These views may not be relied upon as investment advice and, because investment decisions for Parametric are based on many factors, may not be relied upon as an indication of trading intent on behalf of any Parametric strategy. The discussion herein is general in nature and is provided for informational purposes only. There is no guarantee as to its accuracy or completeness. Past performance is no guarantee of future results. All investments are subject to the risk of loss. Prospective investors should consult with a tax or legal advisor before making any investment decision. Please refer to the Disclosure page on our website for important information about investments and risks.
A message from Advisor Perspectives and VettaFi: Discover something new! Click here to register for our upcoming webcasts.
© Parametric
Read more commentaries by Parametric