Global stocks surged during the second quarter as oversold conditions in March and de-escalation in the Middle East created ripe conditions for a rally. In the United States, the large-cap S&P 500 index climbed by 13%, while the small-cap Russell 2000 index increased by nearly 25% (yCharts). International performance was led by emerging markets, which gained over 20% thanks to standout performances from Taiwan Semiconductor, SK Hynix, and other high-profile chipmakers.
Bonds treaded water as geopolitical uncertainty, global monetary policy, and concerns over inflation created a tug-of-war over yields. Commodities moved lower, and energy deserves a special note, as we may be on the cusp of a new market regime that could bring pump prices back to $3.00/gallon by year-end.
Read more: Markets: What to Watch Midway Through 2026
Talking Technicals: A Potential Major Top in Energy Prices
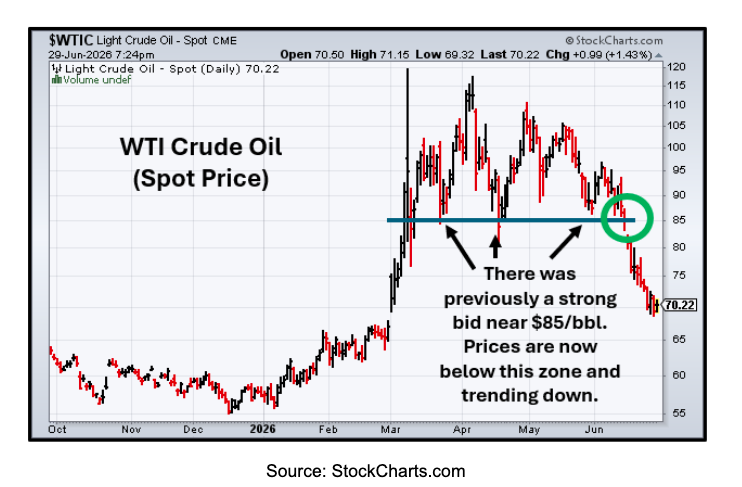
The conflict in Iran was certainly the main news event during the second quarter. "Frequent bombings and a shutdown of the Strait of Hormuz destabilized the region as well as global energy markets." Some Asian markets experienced gas shortages, while the US average pump price jumped to $4.50/gallon by mid-May. Prices have since retraced, with gasoline dropping by $0.50/gallon and crude oil falling from triple digits to about $70/barrel. Still, “headline whiplash” is alive and well, and the news changes day to day as to whether there’s a peace deal that will reopen Hormuz or disagreement will boil over again into even more fighting and destabilization.
When the newsreel is especially noisy, as it is today, it can be wise to turn to alternative tools for market analysis. “Technical analysis” refers to the analysis of the direct flow of money into and out of stocks, bonds, and other investments. The premise is that the ultimate drivers of price for any good, service, stock, or commodity are supply and demand. If you can identify which market force is dominant, you can determine where prices should go next. In this case, technical analysis can help you see through the cacophony of headlines and observe where investors are placing their bets on the future of the Middle East conflict.
The data is quite encouraging when analyzing energy prices. In mid-May, analysis and internal discussion were focused on a potential top forming in oil and gas prices, as signs of trend deterioration were appearing following energy’s meteoric rise from March. Confirmation of the uptrend “breaking” appeared in mid-June when oil prices fell below $85 and wholesale gasoline dropped below $2.90/gallon.

This opens the door to lower energy prices through summer and fall, with our price targets for oil and wholesale gas at $65/barrel and $2.20/gallon, respectively. This translates to pump prices potentially dropping to $3.00 by year-end. In other words, supply has begun to outpace demand, and investors are pricing in normalization within the next few months. We agree and have noted in multiple commentaries that Trump wants neither expensive gasoline nor an unpopular war tainting the Republicans’ odds of a successful midterm election. Of course, markets rarely move in a straight line, and there will certainly be fits and starts, but the probabilities favor that a new downtrend in energy prices is underway.
What About the Fed and Interest Rate Hikes?
The Iran war has certainly stoked inflation, which spiked from 2.4% in February to 4.2% as of May. Rising energy costs contributed to higher prices not only for transportation but also for food, apparel, and other services. Hot inflation data, combined with a particularly hawkish June Federal Reserve statement—“The Committee will deliver price stability”—put the specter of future rate hikes front and center.
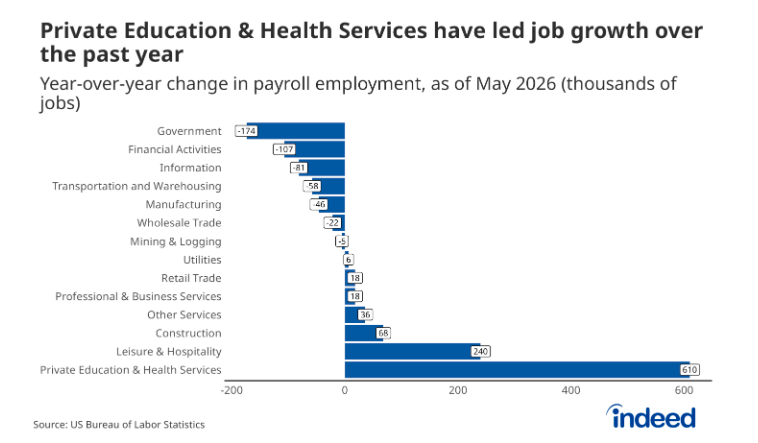
At the same time, the US labor market has been steadily strengthening, marking a change from last fall and winter, when the Federal Reserve was concerned about weakening job growth. In fact, the monthly labor market report from the Bureau of Labor Statistics not only indicated 172,000 jobs added in May, but also revised March and April’s figures (which were already strong) to include an additional 93,000 jobs added. Continuing the trend observed for much of the last year, the biggest job gainers were education, hospitality, and healthcare, while job growth in finance and technology was flat to negative. Below is a chart, courtesy of Indeed, showing job growth across different industries over the last year.
The combination of rising prices and increasing job creation sends policymakers a clear message that combating inflationary pressures should take priority over propping up the labor market. In other words, the exceptionally strong May jobs report may have been a green light for the Federal Reserve to start seriously considering rate hikes, and that’s why stocks sold off so sharply after the report was released on June 5.
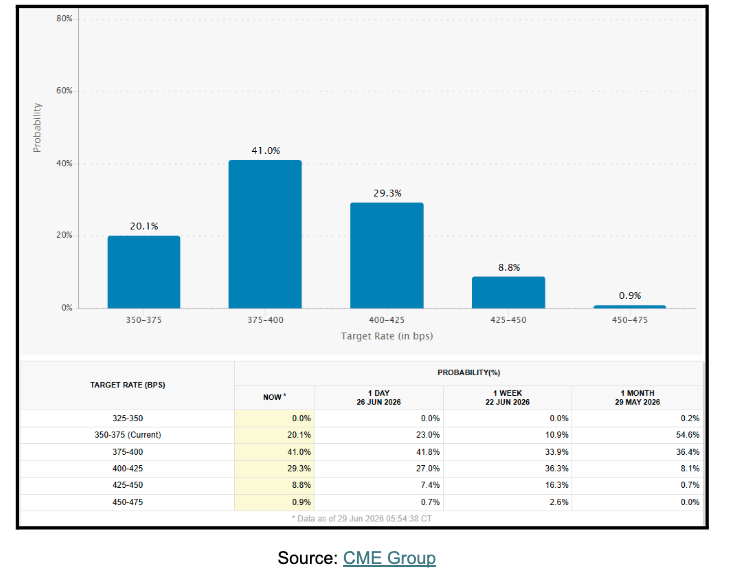
he economy is at an important crossroads: Inflation needs to fall now, or else rate increases will most likely occur. The technical breakdown in and new downtrend in energy prices, as detailed above, couldn’t come a moment too soon, and we believe this will help mitigate the risk of future hikes. We believe the Federal Reserve will only raise rates if it absolutely must. To avoid accusations of “playing politics,” it will also try to avoid rate increases close to Election Day. All considered, our outlook is contrary to consensus, and we expect no hikes, or one at most, through year-end.
What’s Next for Markets?
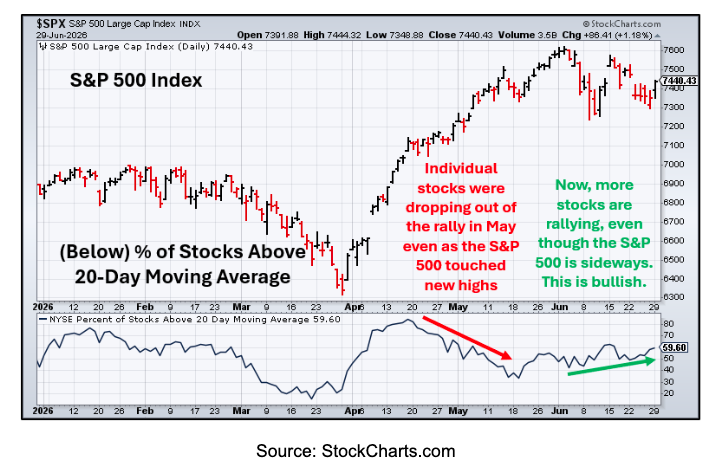
The broad market indices chopped sideways in June, which is unsurprising. After all, the S&P 500 climbed 20.0% from the March 30 market trough through its June 2 peak. Given the magnitude of gains over just two months, one could say that stocks were “overbought” on a short-term basis and were due for a pullback. “Buyer fatigue” was also evident, as many stocks and sectors did not participate in market gains up through the start of June.
Since then, upside progress has stalled, but it’s looking as though the bulls are regaining control. The Q1 earnings season wrapped up with approximately 85% of S&P 500 companies beating analyst expectations, and demand has broadened, with many of the stocks and sectors left out of the May rally “catching up” with positive performances in June.
While there’s always the risk of surprises, current indicators suggest further new all-time market highs in the third quarter. The weeks up to Election Day may also bring increased volatility, but stocks tend to rally in the months following midterms, regardless of the winning party.
Happy Summer
On behalf of WELLth Financial Planning, we wish you and your family a happy summer. As always, we would love to hear from you and can be reached anytime at (561) 972-8011 to discuss all matters financial. Thank you, and we look forward to speaking with you soon.
A message from Advisor Perspectives and VettaFi: Discover something new! Click here to register for our upcoming webcasts.
© WELLth Financial Planning
More Outlooks Topics >