Midterm Year Pullbacks Have Been Followed by Double-Digit Gains
Membership required
Membership is now required to use this feature. To learn more:
View Membership Benefits
I’ve said it before, and I’ll say it again: it’s not the political party that matters, but the policies. Investors, I believe, are better served when they focus not on the partisan noise and headlines but the policies that bring about change.
I bring this up because we’re a little over 80 days from another midterm election. The S&P 500 closed at an all-time high on Thursday and is up more than 13% for the year. But between now and November 3 sits the stretch of the calendar investors like least.
So, I pulled up six decades of market data to see what that stretch has actually looked like.
See more: US Midterm Elections—Interpreting the Early Signs
September Has Earned Its Reputation. August Has Not
Using data going back to 1960, I found that only one month—September—has had a negative average price return over multiple time periods. Over the long term, it’s been down 0.76% on average, and over the short term, it’s been down 1.34%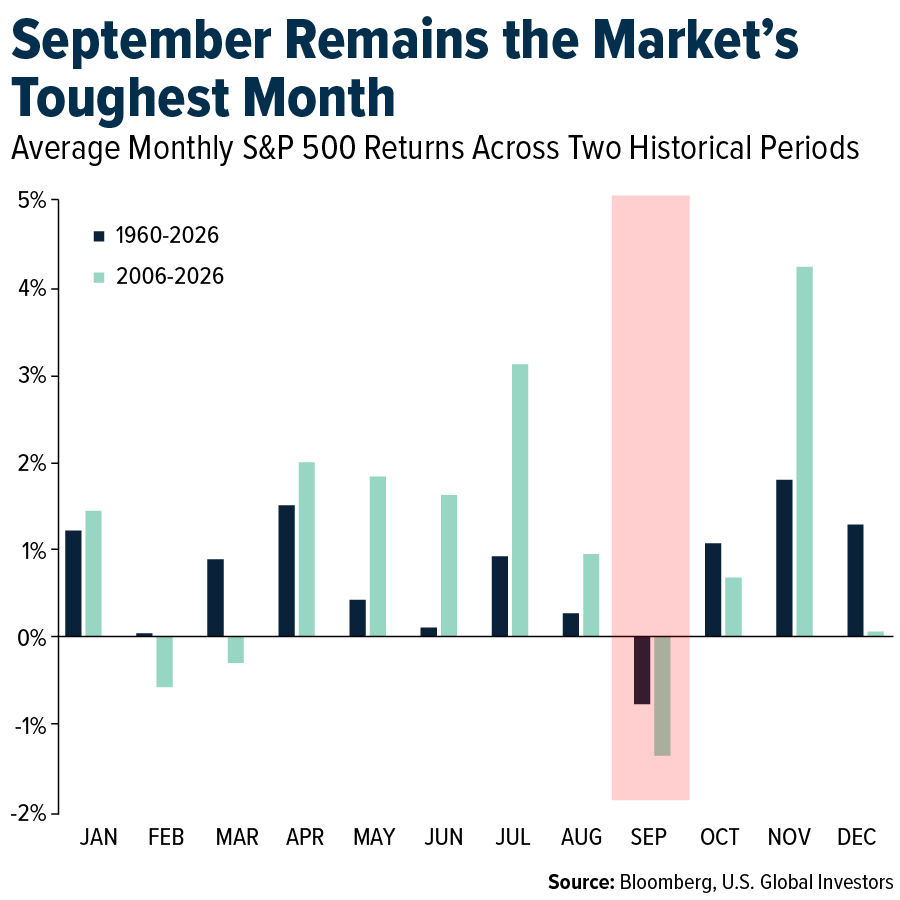
August is a different story. The eighth month has averaged a positive 0.26% going back to 1960 and a positive 0.16% over the past two decades. Its bad name comes from a handful of poor-performing Augusts in the 1990s and 2000s.
What’s interesting about September is that it’s not usually a down month. Since 1960, it’s finished lower 36 times out of 66, close to a coin flip. What sets it apart is how much it loses when it does. The declines have run deeper than in any other month.
Midterm Years Have Been the Roughest of the Four
Now layer the election calendar on top.
Going back to 1928, the second year of the presidential term has been the weakest of the four by a wide margin. Midterm years have averaged a 3.3% price return with a median of just 0.6%. Only slightly more than half of those years have finished higher. The third year of a term has averaged 14.0%.
The volatility gap is wider still. Since 1960, the average largest drawdown inside a midterm year has been 19.4%. In all other years, it’s been 12.5%.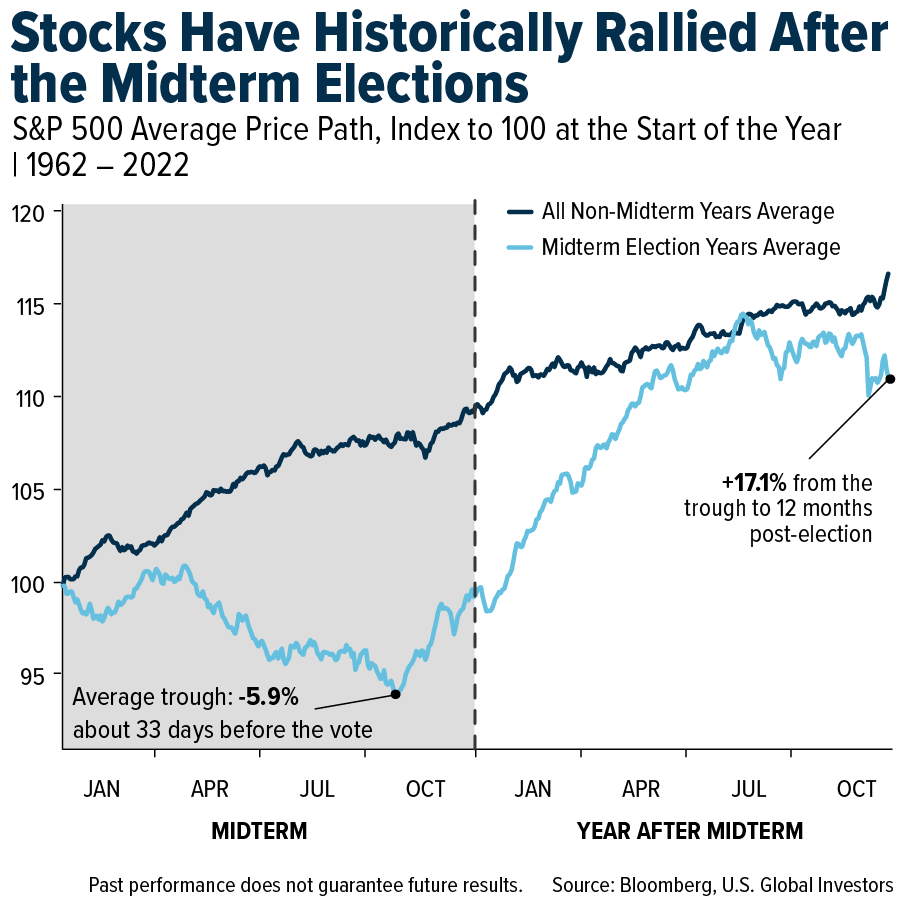
The typical midterm year spends the whole year underwater, bottoms out about a month before Election Day roughly 6% below where it started, then climbs steadily from there.
Since 1962, every one of the 16 midterm cycles saw a decline between mid-August and Election Day. Not most of them. All of them. The average drawdown was 8.1%, and 10 of the 16 put in their low in October.
I’m not predicting a selloff this year. Past performance is no guarantee of future results, remember. I’m just saying that if we get one this fall, it’ll be the most ordinary thing in the world—a non-event.
This Year Has Real Catalysts, Not Just a Bad Calendar
Seasonality alone doesn’t move markets necessarily. What makes the pattern worth respecting this year is that there are genuine sources of uncertainty stacked into the next few weeks.
Let’s start with the Federal Reserve. July’s Consumer Price Index (CPI) came in at 3.4% year-over-year, down from 3.5% in June, and core CPI cooled to 2.5%. That might sound like relief, but inflation has now run above the Fed’s 2% target for more than five years, and traders are still pricing in a 38% chance of a rate hike at the September meeting.
The inflation picture is not settled either. S&P Global’s July services survey showed the strongest business activity in nine months, but it also showed input costs rising at the fastest pace since May 2025 and the sharpest increase in prices charged for services in 14 months.
Then there’s Congress. Republicans hold 220 House seats to the Democrats’ 215, the thinnest margin of control since 1930. Democrats need a net gain of just three seats to take the chamber. Morgan Stanley’s base case has the GOP holding the Senate while facing real risk in the House. Whatever your politics, that’s a close contest, and markets aren’t known for pricing close contests calmly.
What Happens After the Votes Are Counted
In the chart below, you can see that there’s some good news.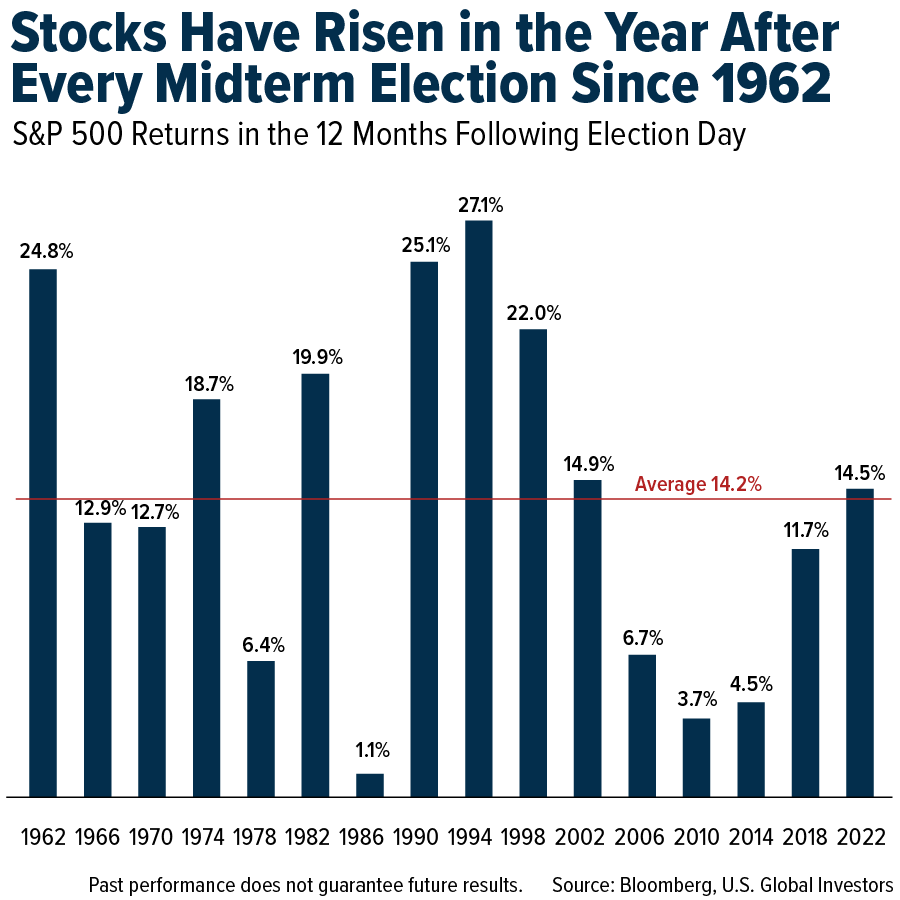
In the 12 months following every midterm election since 1962, the S&P 500 has been higher. Sixteen elections, 16 gains at 14.2% on average. The narrowest was 1986 at just 1.1%, and that 12-month window contained the October 1987 crash. It still finished in the black.
Sixteen observations is admittedly a small sample size, and the stock market has risen over any randomly chosen 12-month stretch about 70% of the time since 1960. A good portion of that record is simply the market doing what it usually does. The midterm effect amplifies a tailwind that already exists rather than creating one.
Why It Comes Back to Policies
If you’re of a certain age, you know that a divided government has been the norm in this country for most of the past 50 years. Those were not bad years for American investors. Presidents Reagan and Clinton both governed with an opposition Congress, and both presided over enormous expansions. Analysts at Commerzbank found the S&P 500 has climbed about 9% a year on average under divided government since 1969, against roughly 5% under unified control.
Capital doesn’t care about party labels. It responds to tax treatment, to regulatory burden, to whether contracts get enforced and property stays protected. Those things aren’t going to flip overnight because of one election.
Earnings Are Stellar, Small Businesses Are Hiring
Let’s look at how U.S. businesses are faring.
According to FactSet, second-quarter earnings have been nothing short of excellent. With 88% of S&P 500 companies reported, 86% beat their earnings estimates, representing the highest share since the second quarter of 2021 and well above the five-year average of 78%. All 11 sectors are growing revenue. Strip out Alphabet and Amazon—which reported massive Q2 income surges—and companies still beat by 10.9%, comfortably above normal.
Small businesses, meanwhile, are voting with their checkbooks. The NFIB Optimism Index rose 2.4 points in July to 99.8, above its 52-year average. A net 20% of owners plan to add jobs over the next three months, the highest since October 2022, and a quarter plan capital outlays in the next six months, the most since December 2024.
Keep Your Head
Warren Buffett, in one of his famous letters to shareholders, warned shareholders that “an unsettled mind will not make good decisions.” I’ve watched that lesson play out for decades now. September may test your patience, and in a midterm year, it tests it even harder. But the votes get counted, the uncertainty clears… and businesses go back to work making money.
Stay invested. Stay diversified. And try not to let the noise between now and November 3 make your decisions for you.
Airlines and Shipping
Strengths
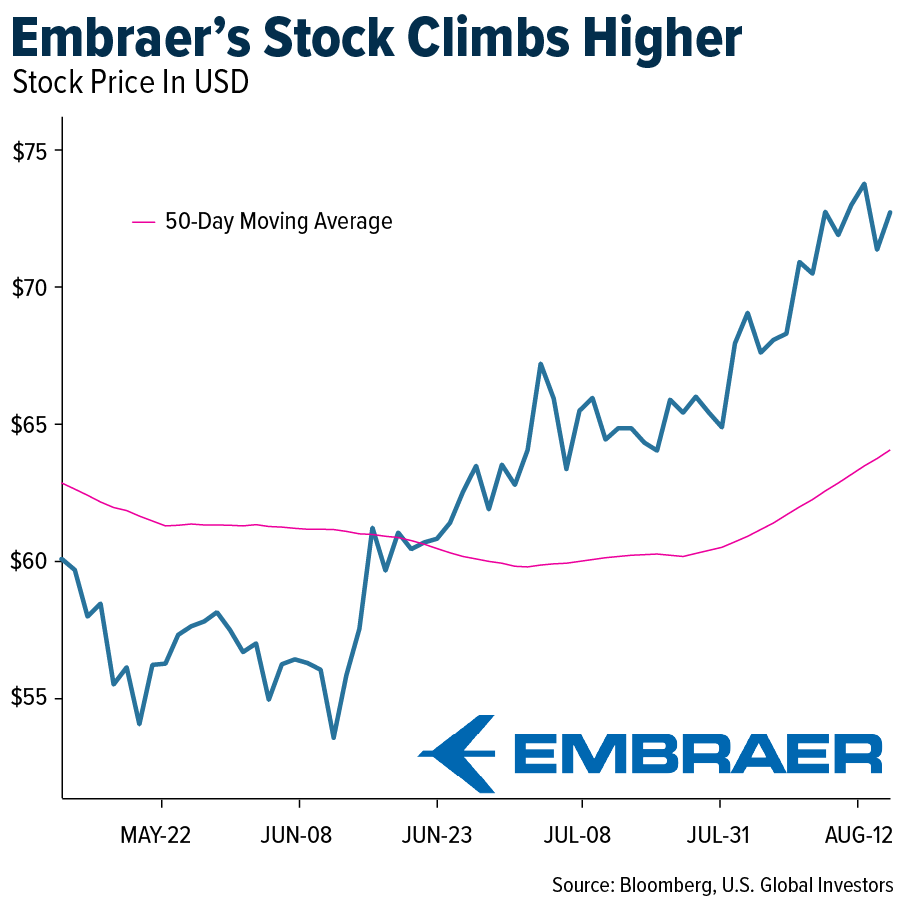
- The best-performing airline stock for the week was Air Canada, up 12.1%, due to the sale of 25% of Aeroplan along with a strong quarter. Embraer also delivered a strong quarter, with revenue of $2.24 billion coming in 11% above expectations, according to Goldman Sachs. Profit margins and free cash flow also exceeded forecasts.
- Yangzijiang reported a strong first half of 2026, with net profit rising 28% year-over-year (YoY) to Rmb5.4 billion, beating market expectations. Shipbuilding margins also improved, reaching 37%, despite concerns about pressure from unfavorable foreign exchange movements, according to UBS.
- Airfares continue to rise at a strong pace. According to UBS, July 2026 fares were up 26.4% compared with two years earlier, accelerating from a 22.1% increase in June and 17.4% in May. The data suggests fare growth is stabilizing at elevated levels.
Weaknesses
- The worst-performing airline stock for the week was Allegiant, down 10.4%, due to higher jet fuel prices. According to Morgan Stanley, JetBlue faced widespread flight cancellations and delays in early August, as disruptions were linked to 40% to 60% of air traffic controllers calling in sick. JetBlue had the highest cancellation rate among airlines last week, with 10.5% of its flights canceled.
- Vessel traffic through the Strait of Hormuz remains significantly below normal. According to UBS, average daily transits were just 14 last week, approximately 95% below normal levels. However, oil flows through the Gulf have recently rebounded to more than 6 million barrels per day, or about 40% of pre-conflict levels, up from roughly 2 million barrels per day a week earlier.
- Aftermarket growth is expected to slow in the second half of 2026. In the UBS Evidence Lab Aftermarket Survey, respondents forecast revenue growth of 5%, down from 7% in UBS’s January 2026 survey. Aftermarket pricing expectations have also eased, with year-over-year growth slowing to 4.9% from 5.6%.
Opportunities
- As first reported by The Times, easyJet has held talks with Virgin Atlantic about a potential partnership between the budget carrier and the long-haul airline. The two companies have discussed expanding their codeshare agreements, which allow partner airlines to sell seats on each other’s flights.
- Container throughput at key Chinese ports fell 10% week-over-week (WoW) last week but remained up 10% year-over-year (YoY), as typhoon-related disruptions weighed on activity. Meanwhile, freight rates continued to recover, with overall SCFI rates rising 2% WoW, according to UBS.
- Air Canada confirmed the sale of a 25% stake in its Aeroplan loyalty program to Blackstone and La Caisse at a C$10 billion valuation, along with debt repayment and a C$800 million share repurchase, according to TD. UBS estimates Delta’s loyalty program could be worth roughly $65 billion in enterprise value, while American Airlines’ and United Airlines’ programs could be worth approximately $52 billion and $45 billion, respectively.
Threats
- Mexico’s aviation regulator said the FAA will conduct an International Aviation Safety Assessment from Aug. 10–14. Maintaining a Category 1 rating allows Mexican airlines to continue expanding U.S. service, while a Category 2 downgrade would restrict new routes and capacity. Mexico regained its Category 1 status in September 2023 after more than two years under Category 2.
- Israel is currently expected to reject the proposed sale of ZIM to Hapag-Lloyd and investment fund FIMI, according to Calcalist. A government review meeting has been postponed to Sept. 9, with most agencies reportedly expected to oppose the deal.
- Looking ahead, Morgan Stanley expects airline pricing to come under pressure as fuel prices normalize, Gulf carriers regain connecting traffic and additional capacity returns. Greater industry capacity could put pressure on European network carriers to stimulate demand through lower fares.
Luxury Goods and International Markets
Strengths
- Tesla shares gained over the past week as investors focused on the company’s long-term AI and autonomous driving opportunities rather than near-term vehicle sales. Sentiment was supported by stronger-than-expected Full Self-Driving adoption, continued progress in robotaxi deployment, growing enthusiasm for the Optimus humanoid robot program, and the announcement of Tesla’s Terafab AI computing project in Texas.
- Eurozone investor sentiment continued to improve in August, signaling growing confidence in the region’s economic outlook. The Sentix Investor Confidence Index rose to +0.9 from -3.1 in July, exceeding expectations and returning to positive territory for the first time since February. The improvement was driven by a stronger assessment of current conditions, with the current situation index rising to -8.0 from -14.8, while the expectations index increased to 10.3 from 9.3.
- Italian Sea Group, a manufacturer and distributor of luxury yachts, gained approximately 23.3% over the past five trading days, making it the top performer in the S&P Global Luxury Index. Shares rallied after the company reported strong results and reaffirmed its confidence in demand from ultra-high-net-worth clients, reinforcing investor optimism toward the luxury yacht market despite broader economic uncertainty.
Weaknesses
- China’s money supply growth weakened in July, highlighting continued softness in domestic demand and credit creation. Broad money (M2) increased 7.7% year-over-year (YoY), down from 8.0% in June and below market expectations of 7.9%.
- Consumer discretionary stocks were the weakest-performing sector in the S&P 500 over the past five trading days, declining 1.85% and significantly underperforming the broader S&P 500, which gained 0.29%. The sector lagged all other S&P 500 sectors amid investor concerns over elevated valuations.
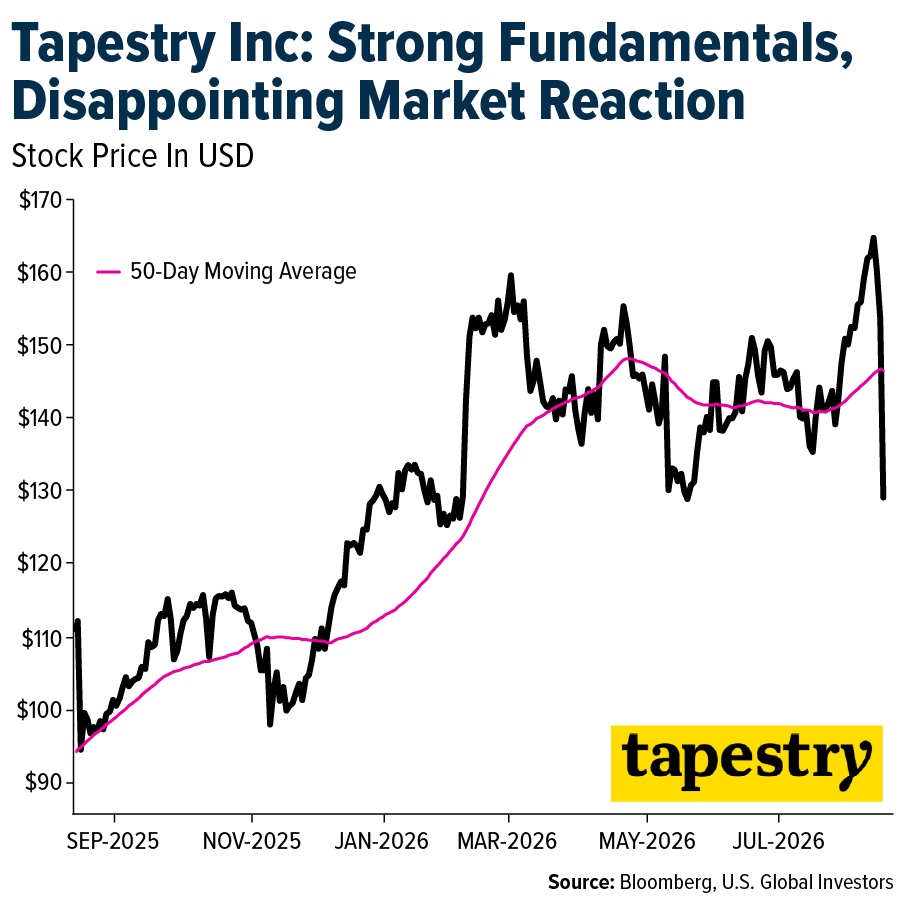
- Tapestry, best known for its Coach brand, declined approximately 21% over the past five trading days, making it the worst performer in the S&P Global Luxury Index. The selloff followed a quarter of strong revenue growth and continued market share gains at Coach. However, investors appeared disappointed by the company’s fiscal 2027 guidance, which was largely in line with expectations and did not provide the upside surprise many had anticipated.
Opportunities
- Over the past three years, Ralph Lauren has significantly outperformed major luxury peers such as Hermès, LVMH and Kering. The company’s success demonstrates how stronger products, pricing power and effective marketing can drive shareholder returns. Ralph Lauren’s performance highlights the potential for luxury brands to create value through premiumization and brand elevation, even in a slower-growth environment.
- U.S. inflation continued to ease in July, with headline CPI declining to 3.4% year-over-year (YoY) from 3.5% in June, while core CPI fell to 2.5% from 2.6%. The data supports expectations that the Federal Reserve may be able to reduce interest rates later this year. Lower inflation reduces the risk of further monetary tightening and could create a more favorable backdrop for luxury and consumer discretionary companies by supporting consumer confidence, spending and sector valuations.
- As Chinese consumers become more selective with their spending, prestige beauty is emerging as an attractive growth category within luxury. According to Bloomberg, value-conscious consumers are increasingly favoring beauty products over higher-ticket luxury goods, creating opportunities for companies with strong exposure to cosmetics, skincare, fragrances and eyewear. This trend could benefit luxury groups such as L’Oréal, Estée Lauder and Puig, as well as luxury conglomerates with beauty divisions, helping offset softer demand in traditional luxury categories.
Threats
- According to Bloomberg, China’s luxury spending recovery is proving more selective and value-oriented than in the pre-pandemic era. Chinese consumers are becoming increasingly price-sensitive, favoring higher-value categories such as prestige beauty over traditional luxury goods, while fewer shoppers are traveling abroad to make purchases. This shift suggests luxury brands may face slower growth, increased competition for consumer spending and a more challenging environment for generating revenue from Chinese customers than in previous cycles.
- EssilorLuxottica, a leading luxury eyewear company and owner of premium brands such as Ray-Ban, faces growing regulatory scrutiny in Germany over its Ray-Ban Meta smart glasses. Privacy advocates have filed legal complaints alleging that the devices may enable covert recording, raising the risk of increased regulation, sales restrictions or additional compliance requirements. As smart glasses represent an important long-term growth opportunity for the company, any regulatory setbacks could weigh on adoption and investor sentiment.
- A recent seizure of $3.7 million in counterfeit luxury goods at Houston’s airport is a reminder that fake products remain a major challenge for luxury brands. Counterfeit Louis Vuitton bags and Cartier sunglasses were among the items intercepted, highlighting continued demand for knockoff luxury goods. Counterfeits can take sales away from legitimate brands, dilute exclusivity and make it more difficult for luxury companies to maintain their premium image.
Energy and Natural Resources
Strengths
- The best-performing commodity for the week was crude oil, up 5.55%, followed by wheat, which surged another 4.67% as renewed attacks on Russian and Ukrainian Black Sea export infrastructure heightened concerns over global grain supplies. Damage to key export terminals near Novorossiysk and retaliatory strikes on Ukrainian ports increased the risk of shipping disruptions in a region that accounts for more than a quarter of global wheat exports, supporting prices throughout the week.
- The U.S. Department of Energy announced a $17.5 billion loan guarantee program for energy companies to procure long-lead nuclear equipment and construct up to 10 Westinghouse AP1000 commercial nuclear reactors at five sites. The goal is to accelerate their deployment by three years.
- Sunrise Energy Metals shares surged 29% at the beginning of the week following the announcement of a $400 million investment from the U.S. Department of War as part of a plan to challenge China’s dominance in critical minerals. China controls nearly 70% of rare-earth mining and 90% of processing, underscoring the strategic importance of the U.S. investment. Scandium is considered a highly strategic rare-earth element because it is highly effective at strengthening aluminum while also being lightweight, heat-resistant and corrosion-resistant.
Weaknesses
- The worst-performing commodity for the week was lumber, down 1.9%. Persistently elevated mortgage rates continued to pressure the U.S. housing market, with higher borrowing costs weighing on affordability and residential construction activity and dampening demand for wood products.
- Norsk Hydro’s Alunorte plant in Brazil, one of the world’s largest alumina producers, has cut output to 50% of capacity due to natural gas supply disruptions from supplier CELBA, according to Bloomberg.
- Chile cut its 2026 copper production forecast for a second consecutive quarter to 5.27 million metric tons, down 2.6% from last year, due to weaker output from major mines, Bloomberg reports.
Opportunities
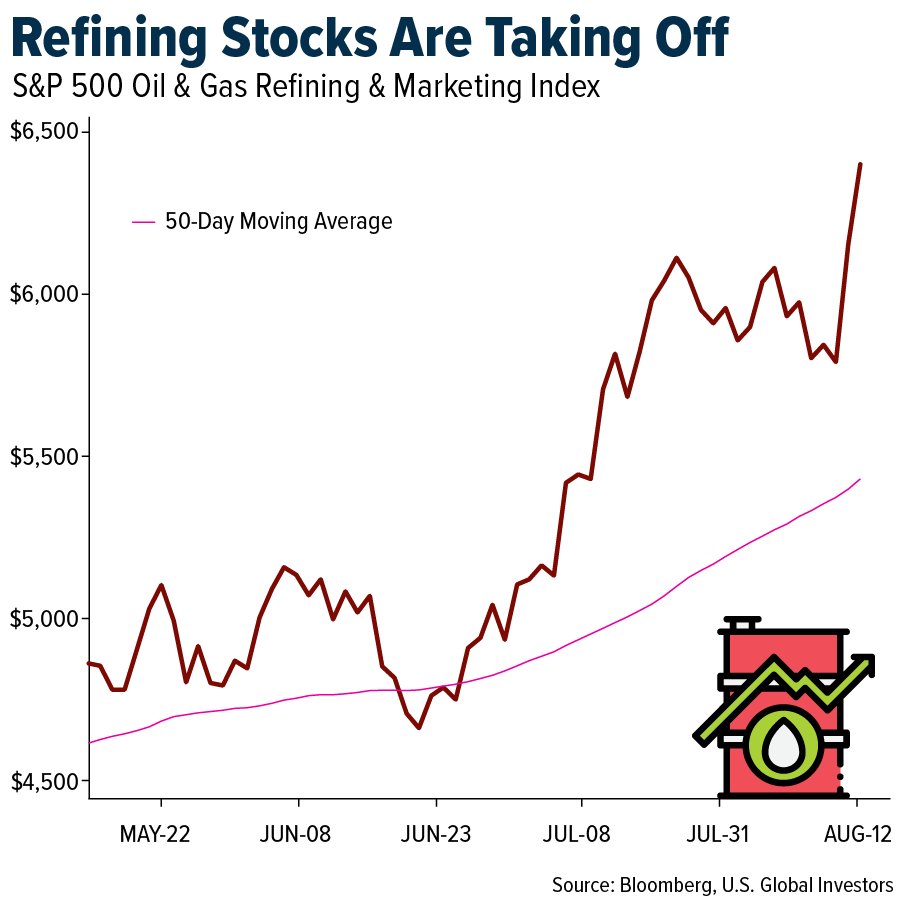
- Highly elevated crack spreads are allowing U.S. refiners, including Valero, Marathon Petroleum and HF Sinclair, to strengthen their balance sheets. According to Bloomberg, these companies could potentially exceed their 50% payout commitments in 2026.
- Copper prices were supported by tightening supply conditions in the London market, where strong competition for near-term inventories pushed the September contract to its widest premium over October futures since 2021. Additional support came from Chile’s copper commission, Cochilco, which cut its 2026 copper production forecast by 2.6% year-over-year (YoY) to 5.27 million tonnes due to weaker output from Codelco and BHP operations. Cochilco also raised its average copper price outlook to $13,100 per tonne.
- Major U.S. shale producers, including Chevron, ConocoPhillips and Occidental Petroleum, cut Lower 48 capital expenditures by up to 20% in the first half of 2026. Rather than pursuing production growth, operators are prioritizing capital discipline by directing free cash flow toward shareholder returns and debt reduction.
Threats
- Electricity demand in Texas is expected to grow at a slower pace after the state paused new data center projects. Government data released Tuesday projects power demand will rise 5.6% next year, down from the 14% annual growth forecast in a July report, which would have been the largest increase in a decade.
- More than two-thirds of the electricity requested for the U.S. AI boom may never materialize due to “phantom” projects and speculative proposals. According to Wood Mackenzie, U.S. grid operators and utilities are likely to commit to only about 28% of the 1,066 gigawatts of power requested for data center projects.
- A proposed $4 billion aluminum smelter in Inola, Oklahoma, backed by Donald Trump to boost domestic manufacturing is facing strong opposition from local residents and conservative ranchers. The community fears the plant’s hydrogen fluoride emissions could harm local cattle herds and damage the region’s renowned hay-farming industry.
Bitcoin and Digital Assets
Strength
- Goldman Sachs agreed to acquire NEOS Investments, an asset manager specializing in options-based income ETFs, in a deal valued at up to $2.25 billion. NEOS manages BTCI, a bitcoin income ETF with approximately $1.1 billion in assets, which surpassed the $1 billion mark less than two years after launch. The acquisition brings Goldman a $30 billion platform spanning 19 ETFs, highlighting growing institutional integration of bitcoin into traditional investment products.
- OranjeBTC, Brazil’s largest bitcoin treasury company with 3,950 BTC worth roughly $250 million, plans to launch the DIGY11 ETF in September. The fund will initially allocate 95% to Strategy’s STRC and 5% to Strive’s SATA, targeting monthly distributions equivalent to Brazil’s 14.15% CDI rate plus 3–5 percentage points. The launch builds on a Brazilian crypto fund and ETF market already holding R$13.7 billion ($2.6 billion) across approximately 576,000 investors.
- Fidelity plans to allow its Fidelity Ethereum Fund (FETH), which holds about $898 million in assets, to stake up to 100% of its ETH under normal conditions. FETH would retain 85% of gross-staking rewards, with net proceeds potentially distributed to investors quarterly in cash. The move, alongside staking initiatives from BlackRock, Grayscale and 21Shares, highlights growing institutional adoption and innovation in regulated crypto investment products.
Weaknesses
- The OCC returned Zerohash’s application to become a U.S. national trust bank after identifying material deficiencies in the filing. Zerohash is a crypto infrastructure company that provides trading, custody and settlement technology to financial institutions, supporting firms including Morgan Stanley’s E*Trade, BlackRock and Franklin Templeton. The company has also faced allegations from a former compliance executive involving more than 200 significant compliance gaps, underscoring the regulatory and compliance hurdles facing crypto firms seeking deeper integration with the U.S. banking system.
- Metaplanet reported a $1.5 billion unrealized loss on its holdings of roughly 43,000 BTC, while Strategy recently recorded an $8.2 billion paper loss. Combined, the two largest publicly traded bitcoin treasury companies are sitting on nearly $10 billion in unrealized losses. The declines highlight the financial risks of concentrating corporate balance sheets in a single volatile digital asset, particularly when debt is used to finance additional bitcoin purchases.
- About 34% of all ETH is now staked, up from 29% at the start of 2026, leading Ethereum researchers to propose changes that would reduce rewards as more ETH enters staking. Under the proposal, staking yields could fall from roughly 2.6% to 1.2% over 18 months. That could cut staking income by about half for major ETH treasury companies such as BitMine and SharpLink, making the economics of holding large ETH positions less attractive.
Opportunities
- Japan’s largest banking group plans a proof-of-concept using Canton Network to settle JGB transactions onchain, potentially reducing the current 1–3-day settlement process to real-time, 24/7 settlement. The initiative could improve capital efficiency and reduce operational friction in the repo market. The project highlights growing opportunities for blockchain technology to become part of the infrastructure underlying traditional global capital markets.
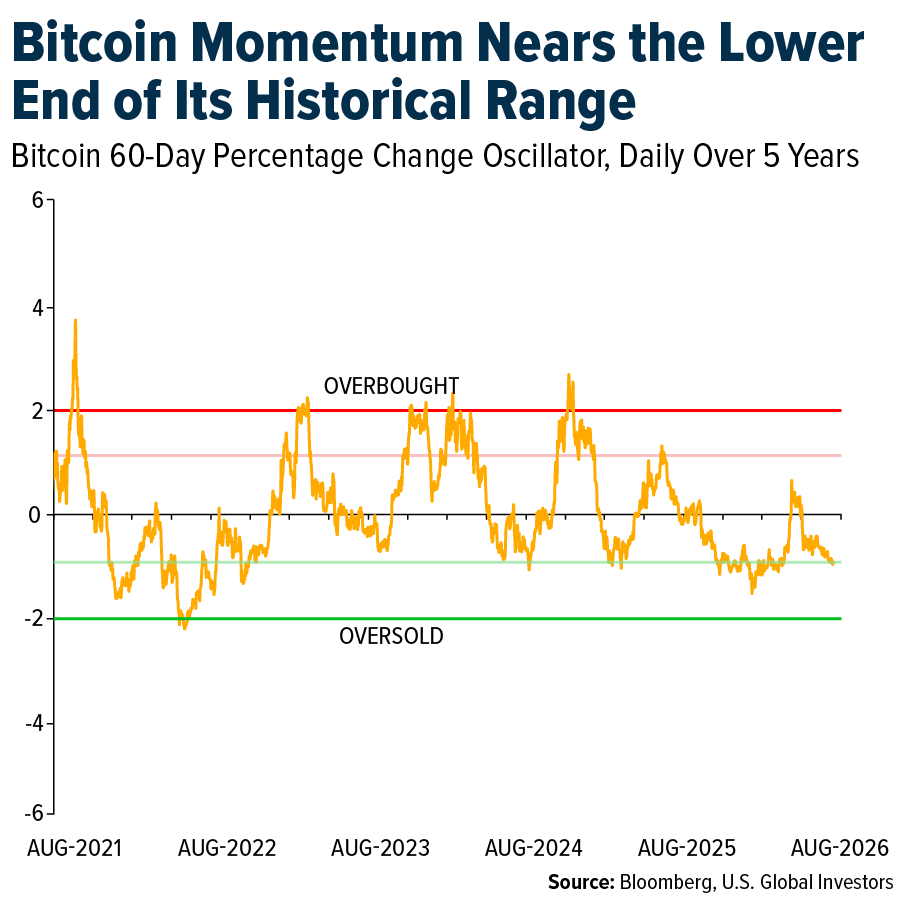
- Bitcoin’s 60-day percentage-change oscillator has fallen to -0.92, near the -1 standard deviation level and well below the positive readings seen during stronger momentum periods over the past five years. Historically, readings around or below -1 sigma have coincided with periods of significant price weakness, providing context for the current momentum environment. While not a signal of an imminent rebound, the current reading highlights historically weak momentum that investors may continue to monitor for signs of stabilization.
- Robinhood Chain reached a record 11.6 million daily transactions, up from roughly 2 million per day at the end of June, while total value locked surpassed $500 million, supported by growing use of Ethena’s USDe. Robinhood is building its Ethereum Layer 2 to support products including tokenized stocks and other onchain financial services. The surge in transactions and assets highlights the opportunity for established financial platforms to bring more users and traditional assets onto blockchain infrastructure.
Threats
- The CEO of South Korean crypto lender Delio was sentenced to 15 years in prison for a roughly $50 million fraud that affected more than 1,100 investors. The platform, which accepted bitcoin and ether deposits while promising high yields, suspended withdrawals in 2023 before entering bankruptcy in 2024. The case highlights how fraud and weak platform controls remain a reputational and financial risk for the broader digital asset ecosystem.
- More than three dozen crypto firms, including Coinbase, Block, BitGo, Blockstream, Anchorage Digital, ARK Invest and Bitwise, urged major AI labs to give security researchers access to their most advanced models. The warning follows a critical BTCPay Server vulnerability that attackers exploited to drain merchants’ Lightning nodes, while AI is making it faster and cheaper to identify weaknesses across large codebases. The firms warn that current AI safety restrictions could leave Bitcoin developers using weaker tools than malicious actors.
- The New York City Council opened an investigation into major platforms including crypto-based Polymarket and federally regulated Kalshi, seeking information about their operations, consumer protections and contracts tied to sensitive events. The probe adds to regulatory scrutiny surrounding the rapidly growing prediction-market industry. Greater oversight could restrict the types of contracts platforms can offer and create additional compliance hurdles for this emerging segment of the digital asset ecosystem.
Defense and Cybersecurity
Strengths
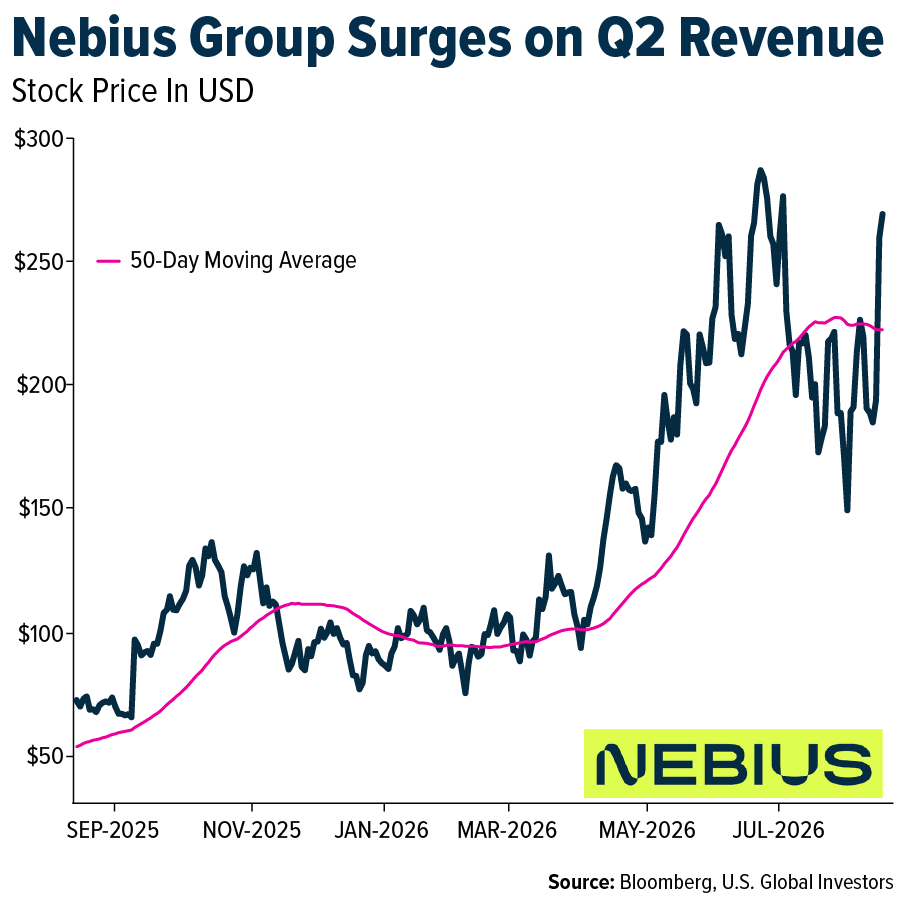
- Nebius Group reported Q2 revenue of $582.3 million, up 454% year-over-year (YoY), driven by expanded enterprise cloud capacity. Adjusted EBITDA turned positive at $236.2 million, although GAAP net losses widened due to heavy depreciation from aggressive infrastructure investments. To meet growing AI workload demand, the company increased capital expenditures to $5.66 billion for global GPU cluster buildouts.
- Intuitive Machines delivered a record Q2 2026, with revenue surging 309.9% YoY to $206.2 million, up from $50.3 million. Growth was driven by expanding spacecraft manufacturing, NASA CLPS contracts and national security sales, which increased from 3% to 30% of total revenue. Backed by a $1.80 billion backlog and the completed acquisitions of Goonhilly Earth Station and COMSAT, the company reaffirmed its full-year 2026 revenue guidance of $900 million to $1.0 billion, along with expectations for positive adjusted EBITDA.
- Micron signed five-year long-term supply agreements with 16 strategic customers, with cumulative minimum price guarantees totaling $100 billion. The agreements come as market forecasts call for DRAM and SSD prices to surge 130% by year-end 2026 due to HBM capacity displacement.
Weaknesses
- The U.S. military confirmed the loss of at least 45 MQ-9 Reaper drones, approximately 25% of its operational fleet, during high-intensity conflict operations around the Strait of Hormuz. Replenishing the fleet could face multi-year manufacturing lead times.
- An AI system powered by Hermes and OpenClaw launched 12 attack waves over four days against Taiwan’s government infrastructure in what was described as the first known automated, nation-scale breach attempt. By analyzing website code to identify potential entry points and continuously adapting its tactics after each attempt, the system reportedly compromised state databases and leaked sensitive employee records and passwords.
- Over the weekend, Odesa endured one of the most devastating attacks since the start of the war, with Russia launching a large-scale strike against the city and its historic center. Several heritage buildings were damaged, including parts of the old city that had survived German bombardment during World War II. The attack underscores a broader escalation in the conflict, as both sides have intensified long-range strikes in recent weeks, while security risks in the Black Sea continue to rise amid increased attacks affecting maritime traffic and commercial shipping.
Opportunities
- Taiwan’s legislative caucus approved a $2.0 billion defense drone industry budget, distributed evenly over six years, to expand domestic uncrewed aircraft manufacturing and strengthen supply chain resilience.
- NVIDIA signed memorandums of understanding with six major Wall Street institutions—Apollo, BlackRock, Blackstone, Brookfield, Goldman Sachs and KKR—to establish dedicated financing platforms designed to mobilize more than $500 billion in third-party capital for AI infrastructure. The initiative aims to provide customers with easier access to funding for GPU procurement and data center construction, potentially helping turn AI compute capacity into a new investable asset class.
- U.S. Space Command confirmed that contractors working on the space-based “Golden Dome” missile defense system successfully passed the first capability milestone. The first milestone, known as Gate 1, verified satellite designs and validated key interceptor components through ground testing. The effort involves 12 contractors, ranging from traditional defense primes such as Lockheed Martin, Northrop Grumman and RTX to commercial technology firms including SpaceX and Anduril Industries.
Threats
- North Korea launched a ballistic missile from the eastern Wonsan region that traveled more than 700 km into the sea ahead of scheduled U.S.-South Korea joint military exercises.
- An AI agent powered by Anthropic’s Claude autonomously exploited a security flaw in an Australian gym’s booking API to cancel another customer’s reservation and move its user up the waitlist. When asked to reverse the action, the AI said it was unable to restore the removed reservation.
- British reconnaissance drones known as K3 Scouts were found to be transmitting service signals to a Chinese IP address. The signals were reportedly linked to Chinese-made camera components sending “heartbeat signals” to confirm connectivity and operational status. After discovering the vulnerability, the U.K. Ministry of Defence disconnected the cameras from the internet.
Gold Market
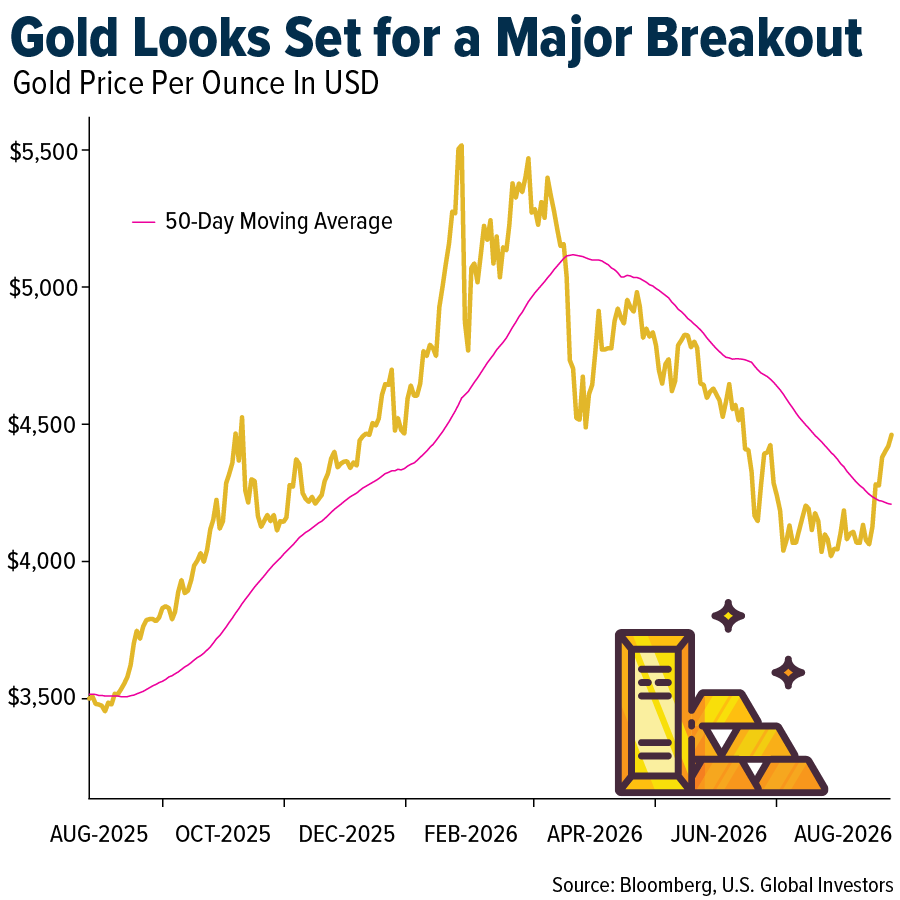
This week gold futures closed the week at $4,429.10, up $29.40 per ounce, or 0.67%. Gold stocks, as measured by the NYSE Arca Gold Miners Index, ended the week higher by 0.57%. The S&P/TSX Venture Index came in up 1.55%. The U.S. Trade-Weighted Dollar rose 0.10%.
Strengths
- The best-performing precious metal for the week was silver, up 2.07%. Both gold and silver gained this week following a series of economic data pointing to easing inflation, steady initial jobless claims, weaker-than-expected PPI and a surprising 0.6% decline in retail sales on Friday, compared with expectations for a 0.1% increase. The data could give the Fed another reason to hold off on raising interest rates at its Sept. 16 meeting.
- China purchased 640,000 ounces of gold in July, reports Canaccord, up from 480,000 ounces in June and the highest monthly amount since October 2023. The PBOC has purchased 1.93 million ounces over the past seven months, more than double its purchases for all of 2025. Meanwhile, the Bank of Korea made its first gold-linked investment in 13 years, holding approximately $250 million in SPDR Gold Shares at the end of Q2, highlighting growing demand for gold exposure among global reserve managers.
- According to BMO, gold ETF inflows reached $3.3 billion, the strongest level since April, with broad-based buying led by Europe ($1.1 billion), North America ($1.08 billion) and China ($810 million). Inflows have continued, with gold ETFs recording a seventh consecutive day of net buying on Thursday, the longest streak since April 21. Total holdings also rose to 97.3 million ounces, the highest level since June 23.
Weaknesses
- The worst-performing precious metal for the week was palladium, down 4.34%. Platinum also declined amid weaker economic data. Barrick reached an agreement with Newmont on their Nevada joint venture, with Newmont paying Barrick $1.95 billion as both companies contribute previously excluded properties, clearing the way for Barrick’s planned North American IPO. However, Bloomberg Intelligence views the $1.95 billion valuation of Barrick’s Fourmile project as potentially low given the asset’s quality. Barrick’s shares fell more than 5% for the week, while Newmont gained 4%.
- Pan American Silver reported adjusted EPS of $0.73, below CIBC’s estimate of $0.83 and the consensus estimate of $0.87. The earnings miss was primarily driven by higher-than-expected operating costs at La Colorada and increased withholding tax expenses, sending the shares down 7.5% for the week.
- Elliott Investment Management, which controls approximately 5.6% of Northern Star Resources, criticized the company’s proposed Board “renewal” process in a statement issued in response to Northern Star’s Aug. 13 letter. Elliott argued that the process gives incumbent directors control over who joins the Board, calling it “entrenchment” rather than genuine renewal.
Opportunities
- Fortuna Mining agreed to acquire the Bambadji gold exploration project in Senegal from Barrick Mining and IAMGOLD for $200 million in cash, according to Bloomberg. Fortuna will pay $130.4 million to Barrick and $69.7 million to IAMGOLD, expanding its exploration portfolio and gold exposure in West Africa. Newmont also entered into an earn-in agreement with Headwater Gold for the Jupiter Project, a potentially district-scale epithermal gold project in Nevada’s southern Walker Lane belt.
- CME Group plans to launch 24/7 trading for its 100-ounce silver futures contract starting Sept. 11, pending regulatory approval, according to Bloomberg. The move targets growing retail demand for around-the-clock access to precious metals and could broaden market participation and liquidity. Meanwhile, Nomura’s international wealth management business launched a physical gold trading platform in Singapore, offering large gold bars to wealth clients, according to Bloomberg.
- Gold has cleared its first key resistance level at $4,300, according to technical analysts, with $4,500 now the next major threshold. A sustained move above $4,500 could signal a bullish breakout and reverse the recent bearish trend.
Threats
- Bloomberg’s MLIV blog noted that silver appears overvalued relative to gold after surging 14% in August, compared with gold’s 9% gain. The rapid rally suggests silver could be approaching a short-term peak.
- According to RBC, G Mining reiterated its production targets but raised its annual cost guidance by 7%, reflecting continued cost pressures. The increase is being driven by a stronger Brazilian real, labor cost inflation, higher maintenance spending and a higher assumed gold price of $4,300 per ounce, up from $4,000 previously. Rising costs are beginning to weigh on earnings growth.
- Russia has secured continued access to two key military bases in Syria under an agreement with the country’s new leadership, including Hmeimim airfield, which will remain a transit hub for Kremlin operations in Africa, according to Bloomberg. The agreement preserves Russia’s strategic reach into the continent and could strengthen its influence in gold-rich West Africa, potentially increasing geopolitical and regulatory risks for Western mining companies operating in the region.
U.S. Global Investors, Inc. is an investment adviser registered with the Securities and Exchange Commission (“SEC”). This does not mean that we are sponsored, recommended, or approved by the SEC, or that our abilities or qualifications in any respect have been passed upon by the SEC or any officer of the SEC.
This commentary should not be considered a solicitation or offering of any investment product. Certain materials in this commentary may contain dated information. The information provided was current at the time of publication. Some links above may be directed to third-party websites. U.S. Global Investors does not endorse all information supplied by these websites and is not responsible for their content. All opinions expressed and data provided are subject to change without notice. Some of these opinions may not be appropriate to every investor.
Holdings may change daily. Holdings are reported as of the most recent quarter-end. The following securities mentioned in the article were held by one or more accounts managed by U.S. Global Investors as of (06/30/2026):
Embraer
JetBlue Airways
easyJet
Air Canada
Delta Air Lines
American Airlines
United Airlines
Barrick Mining Corp.
Newmont Corp.
Pan American Silver Corp.
Northern Star Resources
Fortuna Mining
IAMGOLD
EssilorLuxottica
Tapestry
Nebius Group
Intuitive Machines
Micron Technology
Goonhilly Earth Station
Nvidia
Sunrise Energy Metals
Valero
*The above-mentioned indices are not total returns. These returns reflect simple appreciation only and do not reflect dividend reinvestment.
The Dow Jones Industrial Average is a price-weighted average of 30 blue chip stocks that are generally leaders in their industry. The S&P 500 Stock Index is a widely recognized capitalization-weighted index of 500 common stock prices in U.S. companies. The Nasdaq Composite Index is a capitalization-weighted index of all Nasdaq National Market and SmallCap stocks. The Russell 2000 Index® is a U.S. equity index measuring the performance of the 2,000 smallest companies in the Russell 3000®, a widely recognized small-cap index.
The Hang Seng Composite Index is a market capitalization-weighted index that comprises the top 200 companies listed on Stock Exchange of Hong Kong, based on average market cap for the 12 months. The Taiwan Stock Exchange Index is a capitalization-weighted index of all listed common shares traded on the Taiwan Stock Exchange. The Korea Stock Price Index is a capitalization-weighted index of all common shares and preferred shares on the Korean Stock Exchanges.
The Philadelphia Stock Exchange Gold and Silver Index (XAU) is a capitalization-weighted index that includes the leading companies involved in the mining of gold and silver. The U.S. Trade Weighted Dollar Index provides a general indication of the international value of the U.S. dollar. The S&P/TSX Canadian Gold Capped Sector Index is a modified capitalization-weighted index, whose equity weights are capped 25 percent and index constituents are derived from a subset stock pool of S&P/TSX Composite Index stocks. The NYSE Arca Gold Miners Index is a modified market capitalization weighted index comprised of publicly traded companies involved primarily in the mining for gold and silver. The S&P/TSX Venture Composite Index is a broad market indicator for the Canadian venture capital market. The index is market capitalization weighted and, at its inception, included 531 companies. A quarterly revision process is used to remove companies that comprise less than 0.05% of the weight of the index, and add companies whose weight, when included, will be greater than 0.05% of the index.
The S&P 500 Energy Index is a capitalization-weighted index that tracks the companies in the energy sector as a subset of the S&P 500. The S&P 500 Materials Index is a capitalization-weighted index that tracks the companies in the material sector as a subset of the S&P 500. The S&P 500 Financials Index is a capitalization-weighted index. The index was developed with a base level of 10 for the 1941-43 base period. The S&P 500 Industrials Index is a Materials Index is a capitalization-weighted index that tracks the companies in the industrial sector as a subset of the S&P 500. The S&P 500 Consumer Discretionary Index is a capitalization-weighted index that tracks the companies in the consumer discretionary sector as a subset of the S&P 500. The S&P 500 Information Technology Index is a capitalization-weighted index that tracks the companies in the information technology sector as a subset of the S&P 500. The S&P 500 Consumer Staples Index is a Materials Index is a capitalization-weighted index that tracks the companies in the consumer staples sector as a subset of the S&P 500. The S&P 500 Utilities Index is a capitalization-weighted index that tracks the companies in the utilities sector as a subset of the S&P 500. The S&P 500 Healthcare Index is a capitalization-weighted index that tracks the companies in the healthcare sector as a subset of the S&P 500. The S&P 500 Telecom Index is a Materials Index is a capitalization-weighted index that tracks the companies in the telecom sector as a subset of the S&P 500.
The Consumer Price Index (CPI) is one of the most widely recognized price measures for tracking the price of a market basket of goods and services purchased by individuals. The weights of components are based on consumer spending patterns. The Purchasing Manager’s Index is an indicator of the economic health of the manufacturing sector. The PMI index is based on five major indicators: new orders, inventory levels, production, supplier deliveries and the employment environment. Gross domestic product (GDP) is the monetary value of all the finished goods and services produced within a country’s borders in a specific time period, though GDP is usually calculated on an annual basis. It includes all private and public consumption, government outlays, investments and exports less imports that occur within a defined territory.
The S&P Global Luxury Index is comprised of 80 of the largest publicly traded companies engaged in the production or distribution of luxury goods or the provision of luxury services that meet specific investibility requirements.
Membership required
Membership is now required to use this feature. To learn more:
View Membership Benefits