How US Small-Caps Can Navigate Sustained Leadership
Membership required
Membership is now required to use this feature. To learn more:
View Membership Benefits
Stocks Stay Resilient on the High Seas
After recovering from the “tariff tantrum” that saw stocks of all sizes and styles bottoming out in early April of 2025, equities finished 2025 in admirable shape, carrying the positive momentum into 2026. The resurgent bull was waylaid, or at least distracted, however, when the United States and Israel first bombed Iran at the end of February. It was an abrupt move that sent the major indexes downward, with many finishing 1Q26 in the red. Despite assurances from Washington that any conflict would be brief and resolved to the benefit of both Israel and the United States, matters grew more serious when Iran immediately blockaded the Strait of Hormuz, touching off a shock to global energy supplies.
The open-ended nature of the conflict soon became another item on an already-limited list of concerns, including sticky inflation, increased unemployment, fear of a market bubble (mostly limited to large-cap stocks), a sluggish housing market and record low consumer confidence. Although it would likely have less of an impact on most people’s lives than the issues just listed, there was also growing unease about private credit potentially having a bubble of its own—with ripple effects that are impossible to predict. Needless to say, this gave some commentators an opening to revive deeply unpleasant memories of the 2008-2009 Global Financial Crisis.
The admittedly gloomy picture we’ve painted might lead one to think that stocks were either mired in a slump or that we were forecasting one. Yet, stocks recovered with robust results in 2Q26, and our long-term outlook remains constructive (which we explore in more detail below). To be sure, “resilience” has been the word that springs to mind most often when describing the recent performance of equities. This is true not just for the first half of 2026, but also for the 16 months since that April 2025 low. To bring some balance to the inventory of risks and uncertainties, the economy is growing, unemployment remains low (and is ticking up quite slowly), and consumers are still spending.
Small-Caps Lead the Stock Market Regatta
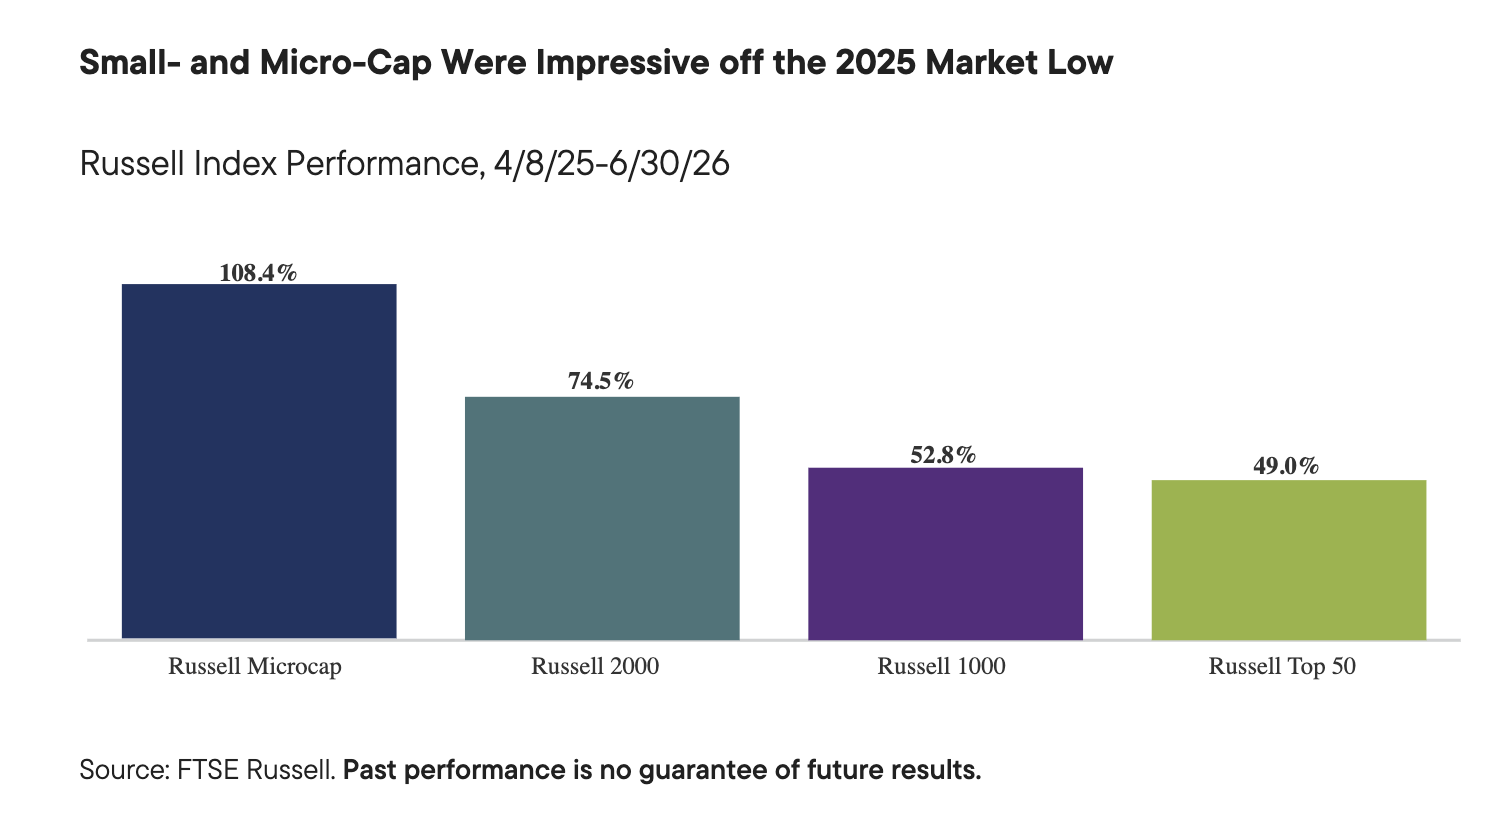
Of course, the big news for us is that the current cycle has seen small-cap stocks reassert leadership after one of the longest periods of underperformance versus large-caps in nearly a century. From 2011 through 2025, small-caps beat their bigger siblings in just two calendar years, 2013 and 2016. This pattern began to shift as share prices rebounded in early April of last year, fueled by especially robust results for micro-cap stocks. Performance off that low has so far been nothing short of extraordinary on both an absolute and relative basis: from 4/8/25-6/30/26, the Russell Microcap Index gained 108.4% and the small-cap Russell 2000 Index increased 74.5%, while the large-cap Russell 1000 Index was up 52.8%, and the mega-cap Russell Top 50 Index rose 49.0%. And though the artificial intelligence (AI) infrastructure buildout has given tech stocks an advantage over much of the market, the tech-heavy Nasdaq also underperformed small- and micro-cap stocks over this period, rising 73.1%. (July saw each of these indexes pull back with losses for the month.)
See more: Beyond the Megacaps: Advisors Eye Small- and Midcap Strategies
Small- and micro-cap stocks led for the year-to-date period ended 6/30/26. In this six-month period, the Russell Microcap gained 27.5% and the Russell 2000 advanced 22.6% versus respective gains of 10.3% and 2.0% for the Russell 1000 and Russell Top 50 (the Nasdaq was up 13.1% for the same period).
Within the Russell 2000, all 11 sectors finished June in the black. Information technology andindustrials led by respectively wide margins, followed by financials and energy. The industries that contributed most to returns in the first half of 2026 were semiconductors and semiconductor equipment (information technology), biotechnology (health care), electrical equipment (industrials), banks (financials), and electronic equipment, instruments and components (information technology), an array that reveals the extent to which AI played a dominant role in small-cap’s first half performance.
There were some interesting differences between the Russell 2000 and Russell Microcap on a sector and industry basis. Information technology was even more dominant in 2026’s first half, more than tripling the contribution of industrials, the micro-cap index’s second-best contributor. As with the Russell 2000, semiconductors and semiconductor equipment led, followed by biotechnology, banks and software. This last industry marked arguably the most significant, and certainly for us the most interesting difference between the indexes, as its contribution in the Russell Microcap was just shy of five times that of the Russell 2000’s. (We note this in part because many software stocks have been under pressure regardless of market capitalization because many observers think the industry may be disintermediated out of existence due to the encroachment of AI.) Ten of the index’s 11 sectors contributed to year-to-date results. Information technology led, while health care, industrials, financials and energy (which has been volatile due to the war with Iran) also contributed meaningfully. Utilities was the only detractor, and its losses were marginal.
Elsewhere in the Small-Cap Flotilla
During a cycle in which tech and biotech stocks have done particularly well, we would not typically expect value to outperform growth. Yet the Russell 2000 Value Index gained 23.0% for the year-to-date period ended 6/30/26, nosing ahead of the 22.2% increase for the Russell 2000 Growth Index. Results from the low on 4/8/25 through the end of June were not as close, and in this period small-cap growth had the advantage, rising 77.1% compared to 71.8% for small-cap value.
Other longer-term periods, however, were better for the Russell 2000 Value, which beat the Russell 2000 Growth for 1-year (+43.0% vs. +38.7%), 3-year (+18.7% vs. +18.4%), and 5-year (+8.2% vs. +5.6%) periods ended 6/30/26, while small-cap growth had the advantage for the 10-year period ended 6/30/26, up 12.0% vs. 10.9%. During July’s mini correction, small-cap value also led (as we would expect), rising 1.3% versus a loss of -5.6% for its growth sibling, thus building on its year-to-date performance edge.
The State of the Race
In the months since small-cap began leading the market, we have observed a fair amount of skepticism in the financial media concerning the likelihood of a sustainable leadership role for our chosen asset class. Although small-cap’s current leadership tenure is just over 16 months old, we are already hearing from some quarters that they cannot possibly stay on top. The reasons, however, do not appear to be grounded in data, certainly not any we have seen (and we keep a close eye on market cap and style-based returns). In a fine display of recency bias, some think that market leadership will revert to the biggest companies mostly because that’s the way the market was behaving for several years before April of 2025.
Others claim that an interest-rate increase will sink any hopes for extended small-cap leadership. This is a well-rehearsed narrative: Rising interest rates are bad for small-cap stocks because smaller companies are seen as carrying higher leverage, depend more on external financing than larger businesses, and are therefore far more vulnerable to increased borrowing costs. This confluence of factors mean that when the Federal Reserve (Fed) tightens monetary policy, small caps could underperform.
History, however, tells a very different story. When we looked at previous Fed tightening cycles, we found little evidence that higher interest rates consistently translated into weaker small-cap performance. What our research also revealed was that earnings were a far more accurate gauge of small-cap performance, on an absolute basis and relative to large-cap stocks. Over time, share prices and earnings consistently converged. Interest rates have occasionally influenced valuations and investor sentiment, but mostly over short-term periods. Long-term returns ultimately followed the path of earnings.
This helps explain why the relationship between rates and small-cap performance can appear inconsistent. The Fed usually raises rates because economic growth is strengthening along with corporate earnings. Conversely, it most often lowers rates when growth is slowing, and earnings expectations are deteriorating. In both cases, the earnings outlook, as opposed to the direction of interest rates, has historically been the more important driver of returns. As with so much in investing, context is key.
How Small-Caps Can Stay at the Helm
If history suggests that a rate hike is unlikely to derail small-cap leadership, what factors appear likely to support it? We would first point to previous market cycles. Using the Center for Research in Security Prices (CRSP) 6-10 as our small-cap proxy and the CRSP 1-5 for large-cap, we went back nearly a century to get a sense of how often and how long each asset class held leadership. (The Russell indexes only go back to the end of 1978.) Our research found eight full cycles prior to the current period, beginning at the end of 1931. Each asset class enjoyed four leadership periods. As the chart below shows, small-cap had two of the three longest cycles; large-cap had the longest and the shortest periods. Most relevant to us is the fact that regardless of which asset class was on top, leadership was durable—the shortest was a large-cap span of 5 years, from the late 1960s into the early 1970s. The three longest periods lasted at least 14 and as long as 16 years.
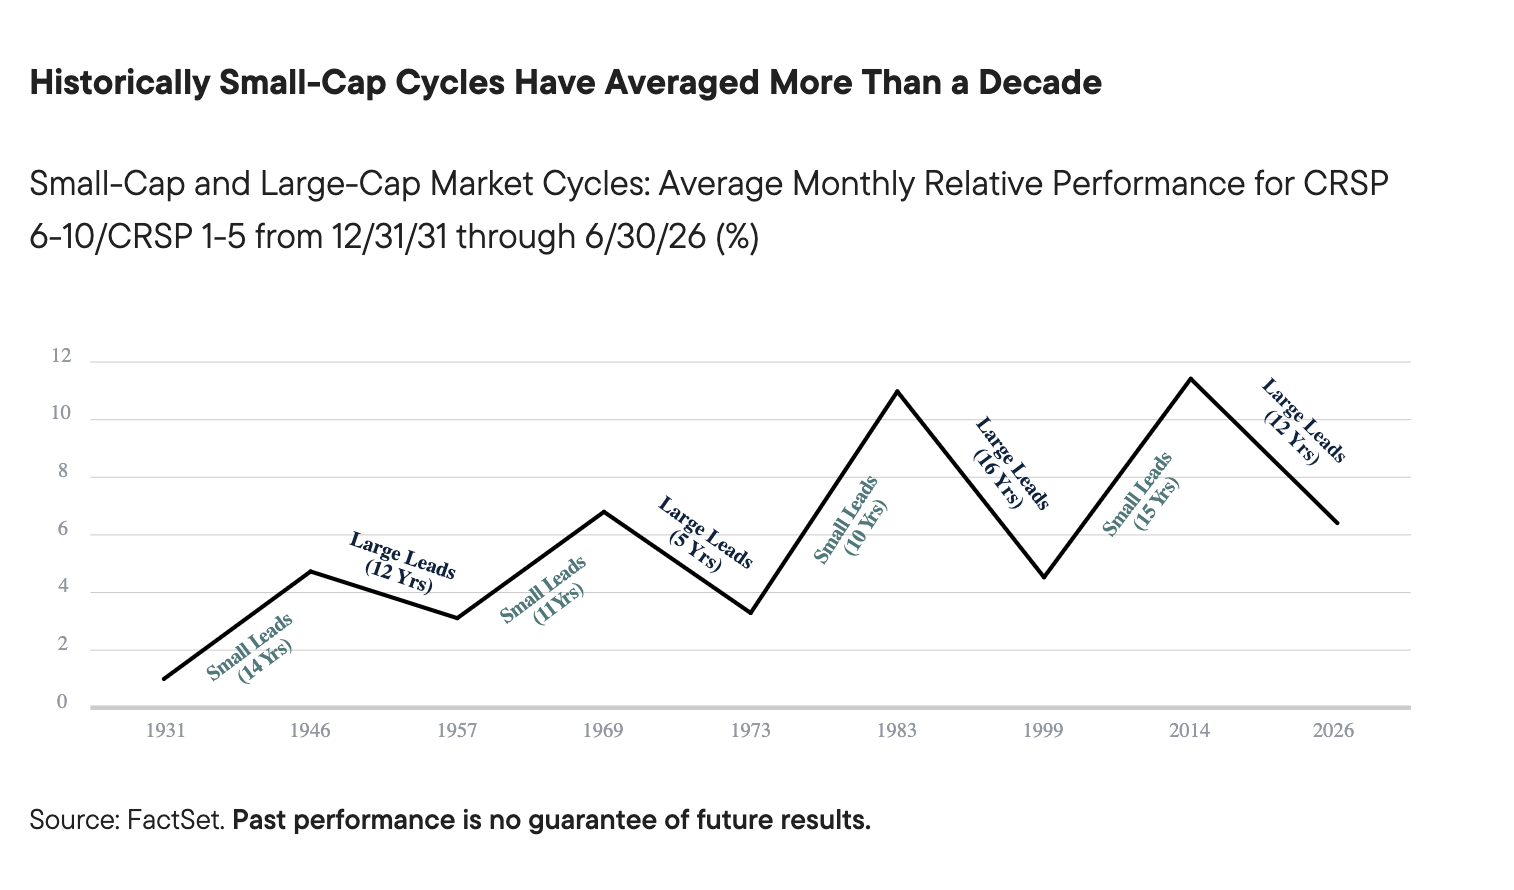
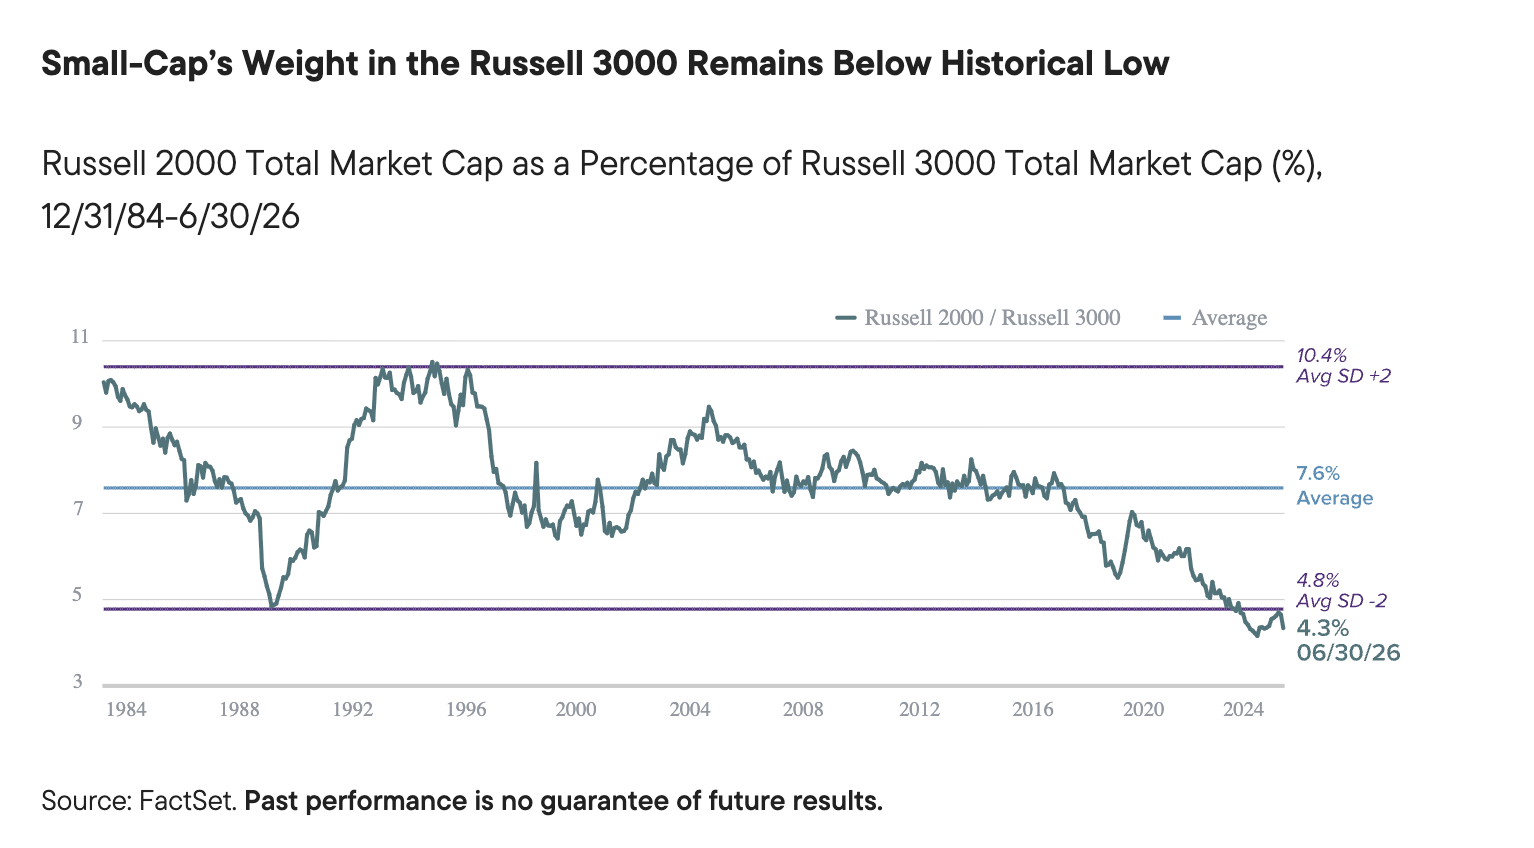
We have not seen any data or research indicating that the nascent small-cap leadership cycle will be markedly different from previous stretches. Equally if not more important, we think there are solid reasons for believing that it can last at least over the next few years, possibly longer. First, the long reign of large- and mega-cap stocks (with Nvidia recently hitting a hard-to-fathom US$5 trillion market cap) meant that small-cap’s weight in the Russell 3000 Index reached a historic low in 2024. The asset class’s recently robust returns notwithstanding, small-cap’s weight is still well below its long-term average of 7.6%, as the chart below shows.
Along similar lines, small-cap returns have not yet closed the valuation chasm between it and large-cap. At the end of June, the Russell 2000 remained much more attractively valued than the Russell 1000, based on our preferred index valuation metric, EV/EBIT (enterprise value over earnings before interest and taxes).
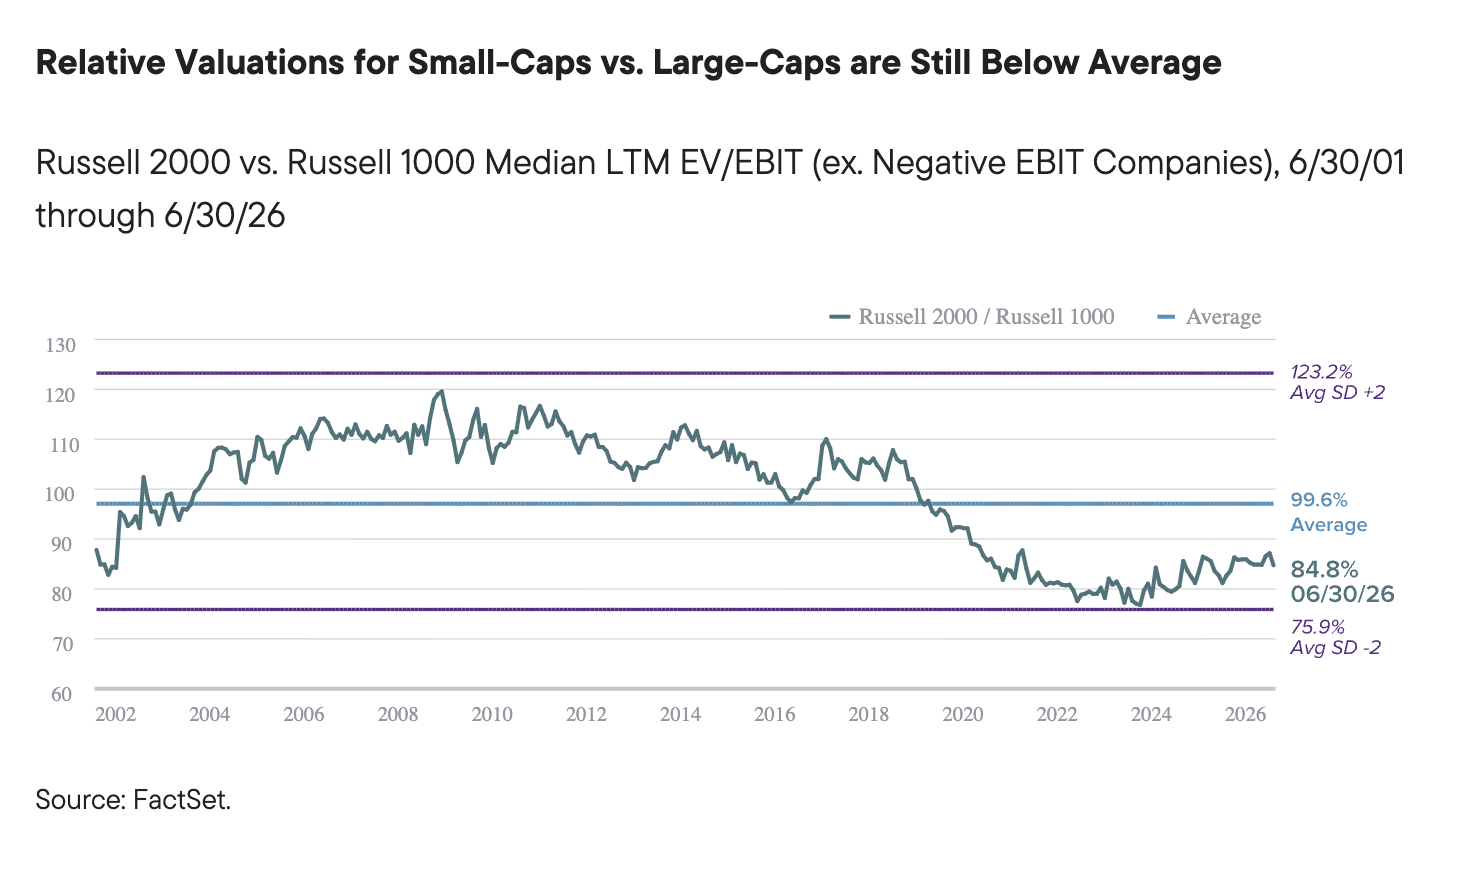
Micro-caps have performed even better than small-caps recently, so one might expect this data to look noticeably different when the Russell Microcap replaces the Russell 2000. However, applying the same EV/EBIT metric to the micro-cap index and comparing it to the large-cap index shows that, though the gap was not as wide, valuations for the Russell Microcap also finished June well below their long-term average compared to the Russell 1000.
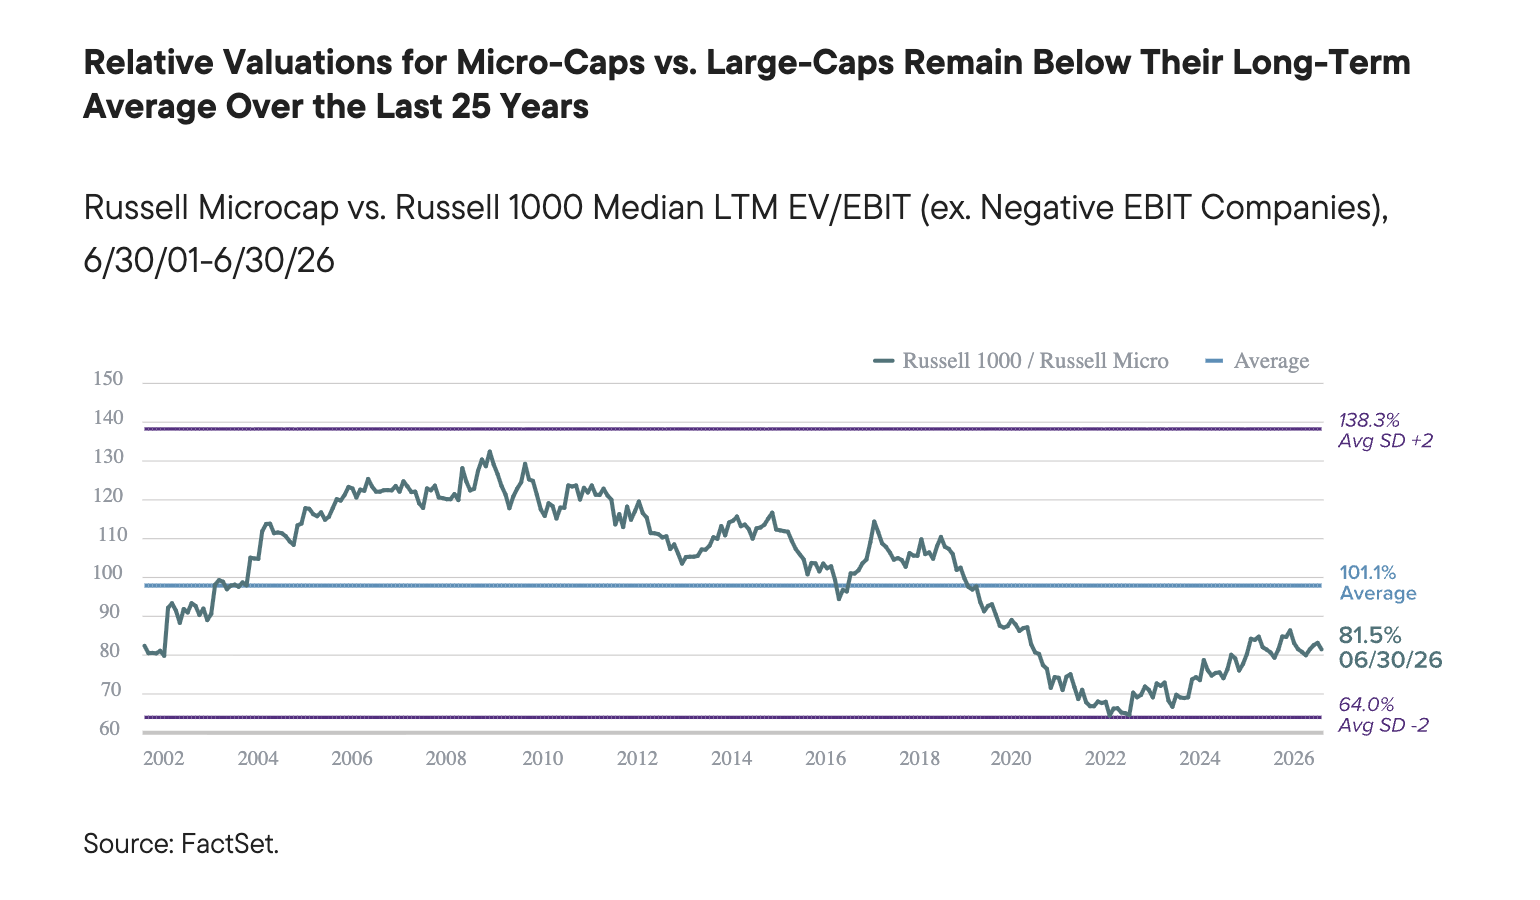
So while a lot is being said about “the market” being overvalued, the data is clear to us that small- and micro-cap stocks have a long way to go before they carry valuations as swollen as most large-cap stocks.
Don’t Fear the Storm Clouds on the Horizon
Volatility has been fairly tame so far this year. The CBOE Volatility Index, or VIX (often called the “fear index”) has given investors mostly smooth sailing through the year’s first seven months, though March and April saw choppy waters when the VIX rose well above 20—which is generally thought to be the point at which stocks exhibit high volatility—as it did again in June and July, though more briefly.
We anticipate heavier weather in the months ahead. The market’s seas seldom remain calm for extended periods; reversion to the mean is common, and nearly all bull markets experience double-digit corrections amid their longer pattern of positive returns. The catalysts for heightened volatility could be related to the general uncertainty over the state of the United States and global economy, adverse geopolitical events, or a pronounced slowdown in economic growth. Even more likely is that a negative development will seemingly materialize out of nowhere and send shockwaves through the market. More than five decades of investment experience have brought home time and again the lesson that downdrafts are rarely the result of what most of us have already been worrying about.
From our perspective, then, it’s more important to see volatility as an ally. It is, after all, a common market force that allows disciplined investors with a long-term horizon to take advantage of short-term movements in order to potentially enhance market-beating results over the long run.
Earnings Are the Tailwind for an Otherwise Foggy Forecast
Many factors, mostly psychological, can influence short-term returns (and cause increased volatility), but over the long run, earnings and profits are what drive performance. For the last several months, we have been arguing that the combination of relatively more attractive valuations and a brighter earnings outlook are the formula for extended small-cap leadership. Nothing occurred in July to change our view—not the sudden burst of higher volatility, not the Fed’s decision in late July to hold the line on rates coupled with the news that certain Fed members, eager to tame inflation, wanted an increase. We think that small-caps will continue to benefit from stronger earnings growth against the backdrop of a growing economy, and consensus estimates continue to point to faster earnings growth ahead (as they have for several months).
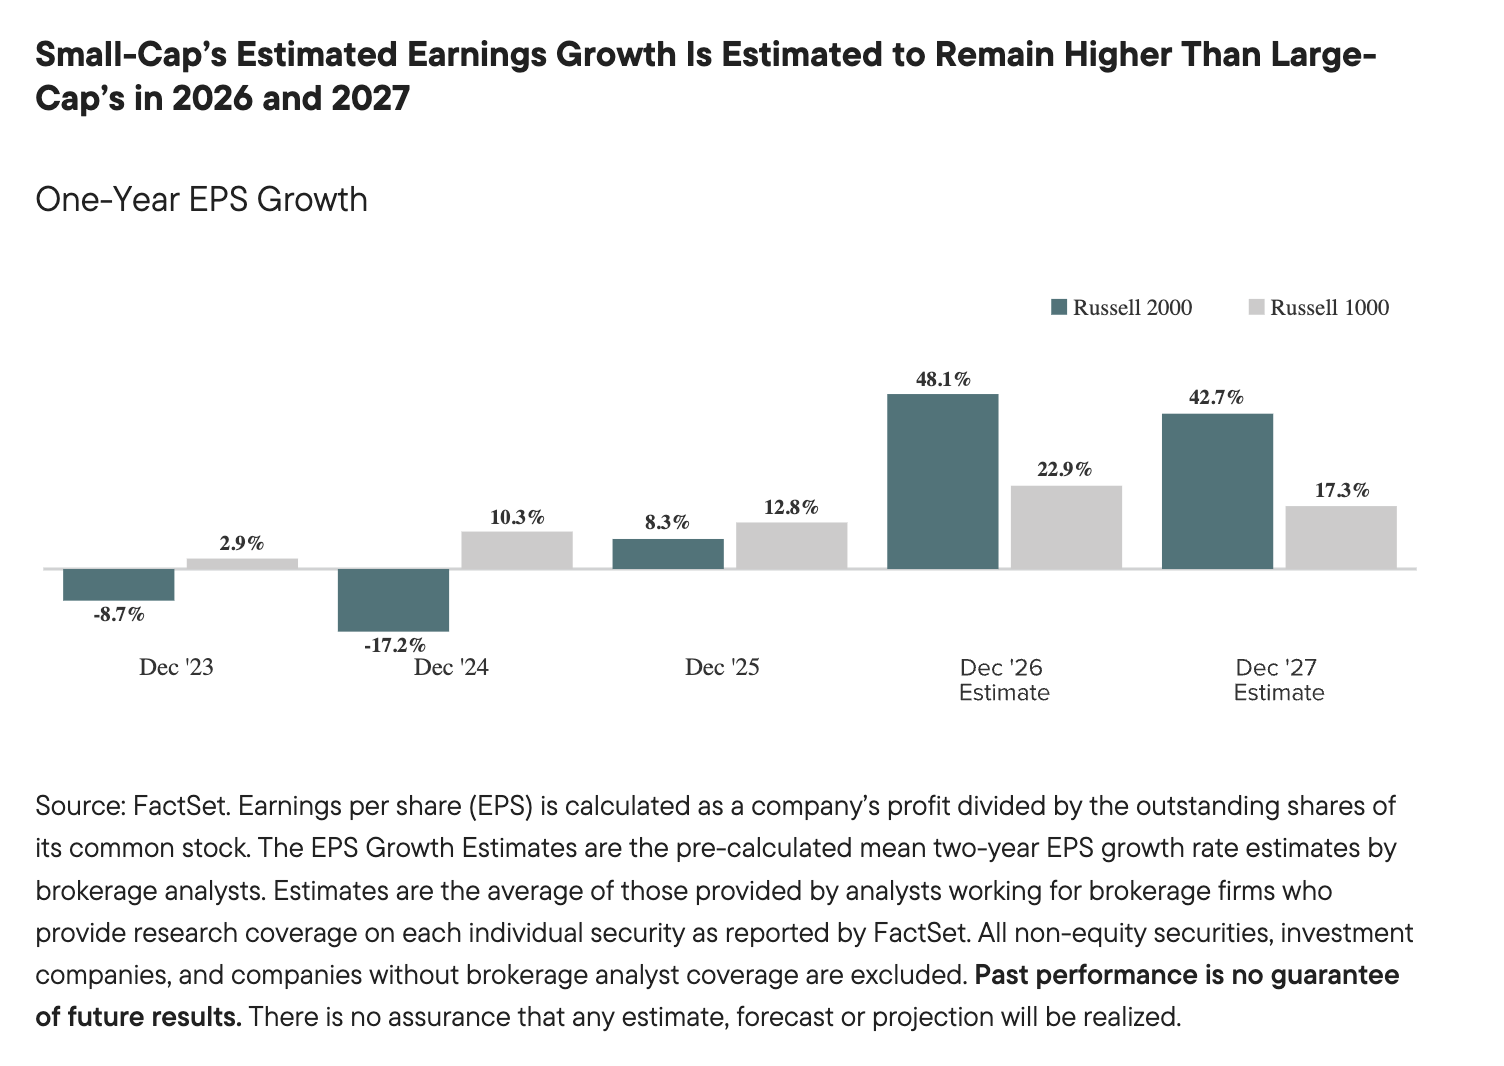
Of course, there are risks. The current war with Iran is even more uncertain than most armed conflicts, other geopolitical issues remain live, the midterm elections are approaching for our deeply divided electorate, low- and middle-income consumers are feeling pinched by inflation, and the slow but steady rise in unemployment. As we mentioned above, there are important counterbalances to these concerns: reshoring, shortened supply chains that are benefiting certain smaller companies, and trillions in AI-related capital expenditure spending all argue in favor of an economy that will keep growing.
An Ocean of Opportunity?
More specifically, most of our investment teams are enjoying a sweet spot between holdings that are doing well while still finding what they think are excellent long-term opportunities in the wide and diverse universe of small- and micro-cap stocks. Many companies that fit our different investment criteria are trading at what we think are attractive multiples. Most are discrete opportunities, but we are finding them in nearly every sector and industry. For example, health care is proving to be fertile ground across most of its industries. consumer staples and consumer discretionary have also presented us with compelling long-term opportunities. To be sure, the best time to buy in the former sector has historically been when most or all consumer sentiment measures are terrible—and sentiment has been consistently hitting new lows with each update to the survey data.
We also believe that we are just beginning to see how companies can benefit from automating and streamlining business processes of all types and look forward to the productivity improvements that will follow. The physical buildout of the AI infrastructure is looking more and more like a multi-year structural phenomenon where we appear to be in the early innings, which is creating interesting investment ideas. Software is a related area, and many companies’ valuations have been dislocated from long-term fundamentals, driven by the perceived threat to their business models from AI. We believe there are pockets of the software industry that will actually benefit from AI, with the possibility of expansion in their addressable market and an increased need for their services.
To further support the idea of widespread opportunities, we think it’s important to note that, while much is made of the fact that more than 40% of the companies in the Russell 2000 have no earnings, the small- and micro-cap universe still has more profitable companies than the Russell 1000 or S&P 500 Indexes. This combination of relatively more attractive valuations and ongoing earnings strength bolsters our conviction that the current environment continues to offer many compelling opportunities for active, fundamentals-driven investors with a long-term horizon.
Definitions
Indexes are unmanaged and one cannot directly invest in them. They do not include fees, expenses or sales charges. Past performance is not an indicator of future results.
The Russell 1000 Index is an unmanaged, capitalization-weighted index of domestic large-cap stocks. It measures the performance of the 1,000 largest publicly traded US companies in the Russell 3000 Index.
The Russell 2000 Index is an index of domestic small-cap stocks that measures the performance of the 2,000 smallest publicly traded US companies in the Russell 3000 Index.
The Russell Top 50 Index is a market-capitalization-weighted index of the 50 largest stocks in the broad-based Russell 3000 universe of US-based equities.
The Russell Microcap Index measures the performance of the microcap segment of the US equity market. Microcap stocks make up less than 3% of the US equity market (by market cap) and consist of the smallest 1,000 securities in the small-cap Russell 2000® Index, plus the next smallest eligible securities by market cap.
The Russell Top 50 Mega Cap Index measures the performance of the 50 largest companies in the US equity market, capturing dominant mega-cap corporations spanning key sectors like technology, consumer discretionary, and health care.
The Russell 2000 Value and Growth indexes consist of the respective value and growth stocks within the Russell 2000 as determined by Russell Investments.
The S&P 500 Index is an unmanaged index of 500 stocks that is generally representative of the performance of larger companies in the United States.
The CBOE Market Volatility Index was introduced in 1993 by the Chicago Board Options Exchange (CBOE) to measure the implied volatility of the US equity market. The index is calculated in real time using the Standard and Poor’s 100 Index (OEX) options. The index is calculated by taking a weighted average of the implied volatilities of eight OEX calls and puts having an average time to maturity of 30 days.
The Center for Research in Security Prices (CRSP) is a premier provider of historical stock market data and investable market indices.
Enterprise value (EV) refers to the entire value of a company after taking into account both holders of debt and equity.
The EV/EBIT multiple is the ratio between enterprise value (EV) and earnings before interest and taxes (EBIT).
Capital expenditure (capex) refers to investment spending in long-term assets (fixed assets). These expenditures include new buildings, machinery, and other equipment needed for an organization's day-to-day operations. Most companies use capex financing to fund their long-term investments.
WHAT ARE THE RISKS?
All investments involve risks, including possible loss of principal. Past performance is no guarantee of future results. Please note that an investor cannot invest directly in an index. Unmanaged index returns do not reflect any fees, expenses or sales charges.
Active management does not ensure gains or protect against market declines.
Equity securities are subject to price fluctuation and possible loss of principal.
Commodities and currencies contain heightened risk that include market, political, regulatory, and natural conditions and may not be suitable for all investors.
Small- and mid-cap stocks involve greater risks and volatility than large-cap stocks.
US Treasuries are direct debt obligations issued and backed by the “full faith and credit” of the US government. The US government guarantees the principal and interest payments on US Treasuries when the securities are held to maturity. Unlike US Treasuries, debt securities issued by the federal agencies and instrumentalities and related investments may or may not be backed by the full faith and credit of the US government. Even when the US government guarantees principal and interest payments on securities, this guarantee does not apply to losses resulting from declines in the market value of these securities.
Any companies and/or case studies referenced herein are used solely for illustrative purposes; any investment may or may not be currently held by any portfolio advised by Franklin Templeton. The information provided is not a recommendation or individual investment advice for any particular security, strategy, or investment product and is not an indication of the trading intent of any Franklin Templeton managed portfolio. Past performance does not guarantee future results.
Any data and figures quoted in this article (unless stated) are sourced from FTSE Russell, FactSet, Bloomberg and Reuters.
Important data provider notices and terms available at www.franklintempletondatasources.com. All data is subject to change.
WF: 12098858
IMPORTANT LEGAL INFORMATION
This material is intended to be of general interest only and should not be construed as individual investment advice or a recommendation or solicitation to buy, sell or hold any security or to adopt any investment strategy. It does not constitute legal or tax advice. This material may not be reproduced, distributed or published without prior written permission from Franklin Templeton.
The views expressed are those of the investment manager and the comments, opinions and analyses are rendered as at publication date and may change without notice. The underlying assumptions and these views are subject to change based on market and other conditions and may differ from other portfolio managers or of the firm as a whole. The information provided in this material is not intended as a complete analysis of every material fact regarding any country, region or market. There is no assurance that any prediction, projection or forecast on the economy, stock market, bond market or the economic trends of the markets will be realized. The value of investments and the income from them can go down as well as up and you may not get back the full amount that you invested. Past performance is not necessarily indicative nor a guarantee of future performance. All investments involve risks, including possible loss of principal.
Any research and analysis contained in this material has been procured by Franklin Templeton for its own purposes and may be acted upon in that connection and, as such, is provided to you incidentally. Data from third party sources may have been used in the preparation of this material and Franklin Templeton ("FT") has not independently verified, validated or audited such data. Although information has been obtained from sources that Franklin Templeton believes to be reliable, no guarantee can be given as to its accuracy and such information may be incomplete or condensed and may be subject to change at any time without notice. The mention of any individual securities should neither constitute nor be construed as a recommendation to purchase, hold or sell any securities, and the information provided regarding such individual securities (if any) is not a sufficient basis upon which to make an investment decision. FT accepts no liability whatsoever for any loss arising from use of this information and reliance upon the comments, opinions and analyses in the material is at the sole discretion of the user.
Franklin Templeton has environmental, social and governance (ESG) capabilities; however, not all strategies or products for a strategy consider “ESG” as part of their investment process.
Products, services and information may not be available in all jurisdictions and are offered outside the U.S. by other FT affiliates and/or their distributors as local laws and regulation permits. Please consult your own financial professional or Franklin Templeton institutional contact for further information on availability of products and services in your jurisdiction.
Issued in the U.S. by Franklin Templeton, One Franklin Parkway, San Mateo, California 94403-1906, (800) DIAL BEN/342-5236, franklintempleton.com. Investments are not FDIC insured; may lose value; and are not bank guaranteed.
You need Adobe Acrobat Reader to view and print PDF documents. Download a free version from Adobe's website.
CFA® and Chartered Financial Analyst® are trademarks owned by CFA Institute.
A message from Advisor Perspectives and VettaFi: Discover something new! Click here to register for our upcoming webcasts.
Membership required
Membership is now required to use this feature. To learn more:
View Membership BenefitsSponsored Content
Upcoming Virtual Events View All