In the world of technical analysis, there is one reliable indicator for measuring market risk. The relative strength index (RSI) measures overextension (in either direction). Developed by J. Welles Wilder in 1978, the RSI is a momentum oscillator. As such, it measures the velocity and magnitude of price changes, plotting those on a scale from 0 to 100.
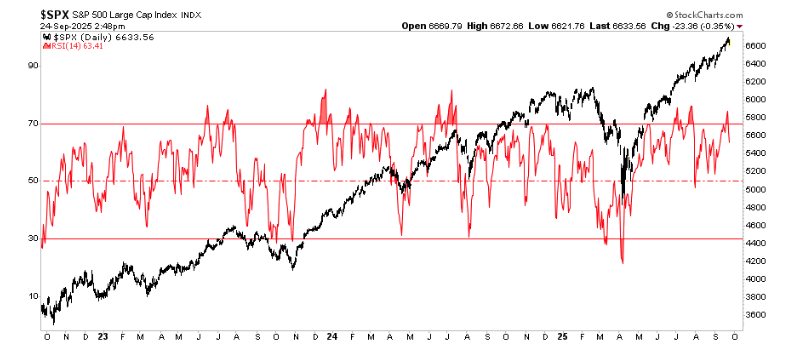
At its core, the RSI compares the magnitude of recent gains to recent losses over a chosen lookback period. Investors commonly use a lookback period of 14 days to estimate whether a market (or stock) is overbought or oversold. Readings above 70 are often flagged as “overbought,” while readings below 30 are considered “oversold.” The chart below shows a stock market sample versus the 14-day RSI.

Why is it so helpful? Because markets don’t just move in a straight line forever. While it may seem that way at extremes, momentum tends to exhaust, and reversals or corrections become more probable. The RSI gives us a real-time gauge of when a trend may be vulnerable to a pullback or turn. It’s not perfect, and as is often the case, things can remain “overbought” much longer than seems logical. However, as a risk management metric, it’s among the cleaner, more actionable oscillators in an investor’s toolkit.
Importantly, the RSI also gives us a way to spot divergences. For example, notice above that in December 2023, RSI peaked and began to decline even as the market advanced. This is known as a negative divergence and tends to precede corrections. Other signals include failure swings (RSI pushes above a threshold and fails) or confirmation of trend strength (e.g., crossing 50). Notably, RSI is not a standalone “buy/sell” signal. However, it is one of the more disciplined guardrails to judge when exuberance or fear is becoming excessive.
A Thought Experiment
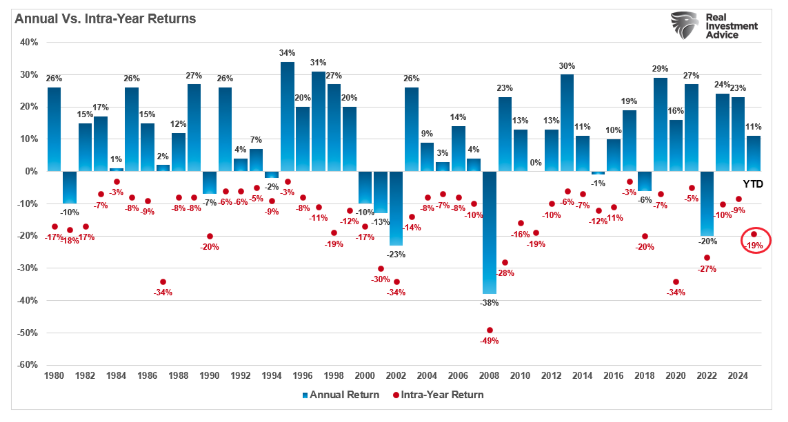
While I find RSI very useful in managing short-term portfolio risks, I was looking at a long-term market chart and wondered if it could give us some clues about the next more significant corrective cycle. I am not talking about minor 5-10% corrections in any given year; those happen constantly. As we noted in “Bullish Years Have Corrections,”
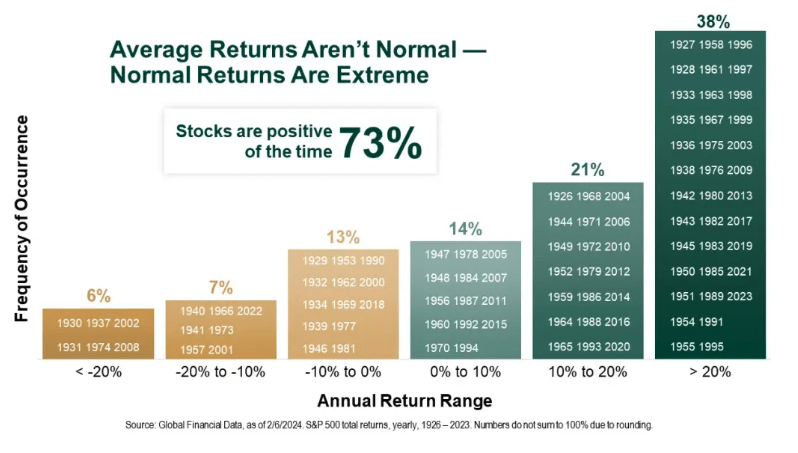
During bullish years, corrections happen more often than you think. However, when corrections occur, it is not uncommon to see concerns about a “bear market” rise. However, historically speaking, the stock market increases about 73% of the time. The other 27% of the time, market corrections reverse the excesses of the previous advance. The table below shows the dispersion of returns over time. Critically, note that drawdowns of greater than 10% only occur 13% of the time.
However, 10% or less market corrections are more common and occur in every bullish year, as shown.
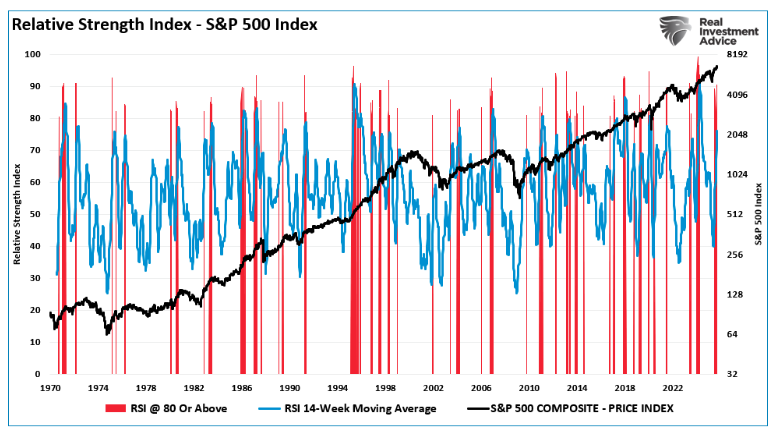
For this thought experiment, I was curious about the lead time between more extreme weekly RSI readings and the time lag to a more notable correction or bear market. While most investors use a daily measure of RSI, such as 14 days, over extended periods, a daily reading becomes more noise than signal. Therefore, to generate a better “signal”, I used 14 weeks to smooth the volatility. That chart of the 14-week RSI versus the S&P 500 is shown below.
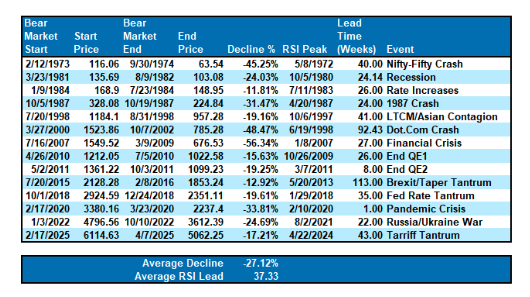
The red shaded areas represent when the weekly RSI readings were above 80. I then looked at these periods when readings were above 80 and calculated how long until a more significant event occurred, such as the 1987 crash or the Dot.com crisis.
The table below shows the peak of a bull market advance, the percentage decline of the correction, the lag between an elevated RSI reading and the start of the correction, and the corresponding event. It is worth noting that while there were some more significant declines, such as the Nifty-Fifty crash, the Dot.com and Financial Crisis, there were also some milder corrections. In other words, not every elevated RSI reading is the precursor of a significant bear market. The average drawdown was 27% with an RSI lead time of 37 weeks. In other words, as we already knew, bull markets can remain overbought for quite some time.
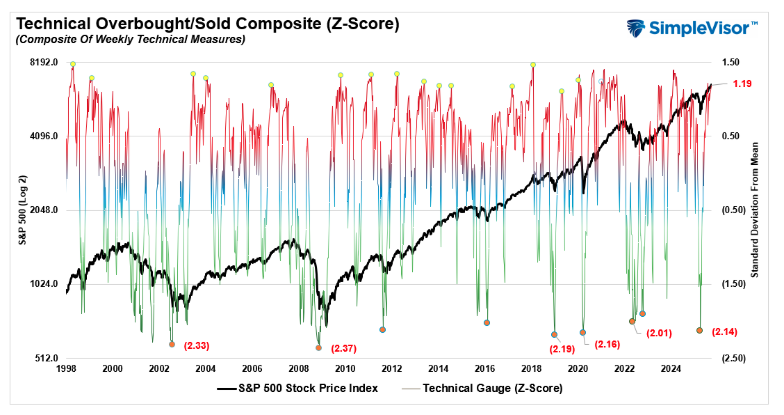
Currently, the 14-period weekly RSI is nearing 70, and while not yet at extremes, it is undoubtedly at levels that can precede more normalized downturns (5-10%). Furthermore, our weekly technical gauge, which we publish in real time at SimpleVisor.com, is also at levels that typically precede notable corrections, even during raging bull markets.
As noted, this all matters because history suggests that there is often a lag/gap between when the RSI first reaches high levels and when a meaningful correction actually hits. In prior cycles, the RSI will frequently flirt with high zones (70–80+) and stay there while markets continue higher, sometimes for weeks or even months, before the reversal or correction finally arrives. However, when the market ignores the overbought condition and doesn’t immediately correct, investors become emboldened to take on more risk, believing “this time is different.”
Unfortunately, it never is.
Assessing Current Market Risk & Portfolio Posture Guidance
Putting it all together: with the weekly RSI and other technical indications becoming more overbought, valuation metrics stretched, and macro uncertainties rising, the market is likely closer to a correction than another leg of the bull market higher. However, that isn’t to say this market can continue its recent push higher, into year-end, as the professional managers chase returns for year-end reporting, corporations ramp up buybacks, and earnings growth continues.
The trick for investors is to continue riding the “bull market” while it is running. However, when the ride stops, it tends to be a sudden and sharp reversal with little warning.
- Raise your guard. Don’t dismiss elevated RSI because “the market always moves higher.” Historically, corrections or pullbacks tend to come when momentum wanes, not just when RSI hits a number.
-
Trim into strength. If you’ve got extended sectors or names showing weakening internals or divergences, consider locking in profits gradually. Don’t try to perfectly time the top; just manage your risk.
- Raise cash modestly. It doesn’t hurt to gradually build dry powder, which can be a risk-free hedge. If the market breaks, you want the flexibility to reposition.
-
Watch the internals, breadth, and divergence. A rolling market with weak breadth or sector concentration and a weakening RSI is more dangerous than a “broad advance + rising RSI” signature.
- Avoid blindly chasing speculative momentum. When speculative names push RSI into extreme territory (especially small caps, high multiple names, etc.), the downside is asymmetrically greater.
Given current RSI readings and the absence (so far) of a confirmed breakdown, the prudent posture is neutral to slightly defensive, not outright bearish, but certainly not complacent. With valuations elevated and macro crosswinds (inflation, credit stress, policy uncertainty) still very much present, the risk of a pullback or correction is higher now than it has been for many months.
If I were managing portfolios, I’d favor:
- Staying underweight speculative or levered exposures
- Holding more cash relative to normal
- Use defensive positioning that doesn’t drag performance in a mild up move
- Leaning toward quality, low-volatility, income-oriented names
- Monitoring RSI, breadth, credit spreads, and macro signals closely, as early surrenders of momentum can be early clues that a correction is imminent
In sum: the RSI is flashing caution. It isn’t screaming “go home now,” but it’s indeed signaling that risk is elevated and investors need to manage exposures more actively. Markets may persist higher, but the path forward is narrower, and patience (and discipline) will likely be rewarded.
That’s my thought experiment.
Lance Roberts is a Chief Portfolio Strategist/Economist for RIA Advisors. He is also the host of “The Lance Roberts Podcast” and Chief Editor of the “Real Investment Advice” website and author of “Real Investment Daily” blog and “Real Investment Report“. Follow Lance on Facebook, Twitter, Linked-In and YouTube Customer Relationship Summary (Form CRS)
Join RIA Advisors and elevate your career within a deeply experienced team focused on innovation. Our collaborative environment is built on a foundation of advanced technology and effective investment models, designed to enhance your ability to serve clients and grow your practice. Benefit from a supportive culture that encourages professional development and fosters a forward-thinking approach. By joining our team, you’ll be part of a group dedicated to excellence and continuous improvement, empowering you to focus on building meaningful client relationships and pursuing your business ambitions. Discover the advantages of working with our accomplished advisory team by starting your conversation today.
A message from Advisor Perspectives and VettaFi: Discover something new! Click here to register for our upcoming webcasts.
© Real Investment Advice
Read more commentaries by Real Investment Advice