Bull Market Pullback: Why The 4.5% Dip Held The 50-DMA
Membership required
Membership is now required to use this feature. To learn more:
View Membership BenefitsKey Takeaways
- After nine straight up weeks, the bull market pullback we flagged finally arrived, and it stopped cold at the 50-day moving average.
- The selloff reset an overbought tape without breaking trend. RSI fell from above 70 to the low 40s, and Thursday’s bounce came on broad participation.
- Our Money Flow Breadth Ratio ticked up to 60%, back in buy territory, and we’re holding equity exposure at 100%.
- The bigger risks haven’t gone anywhere: record margin debt, fading retail demand, and a 10-year Treasury that now out-yields the S&P 500.
- This sets up more upside for now. It does not erase the odds of a deeper correction this summer if forward earnings expectations crack.
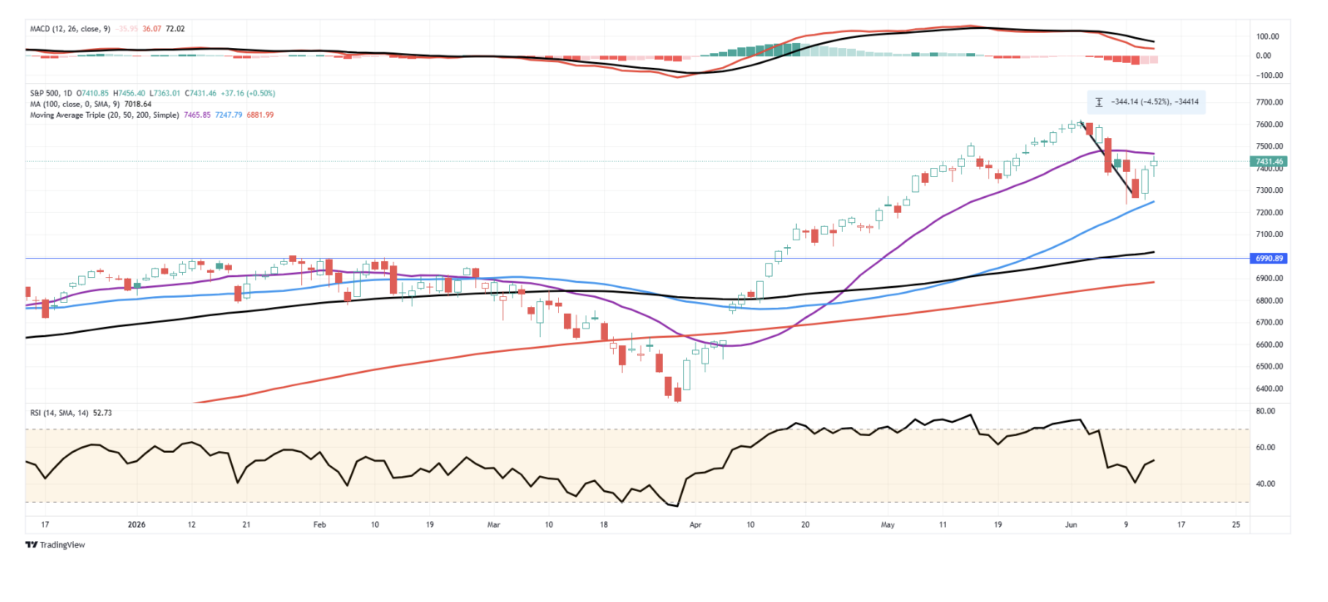
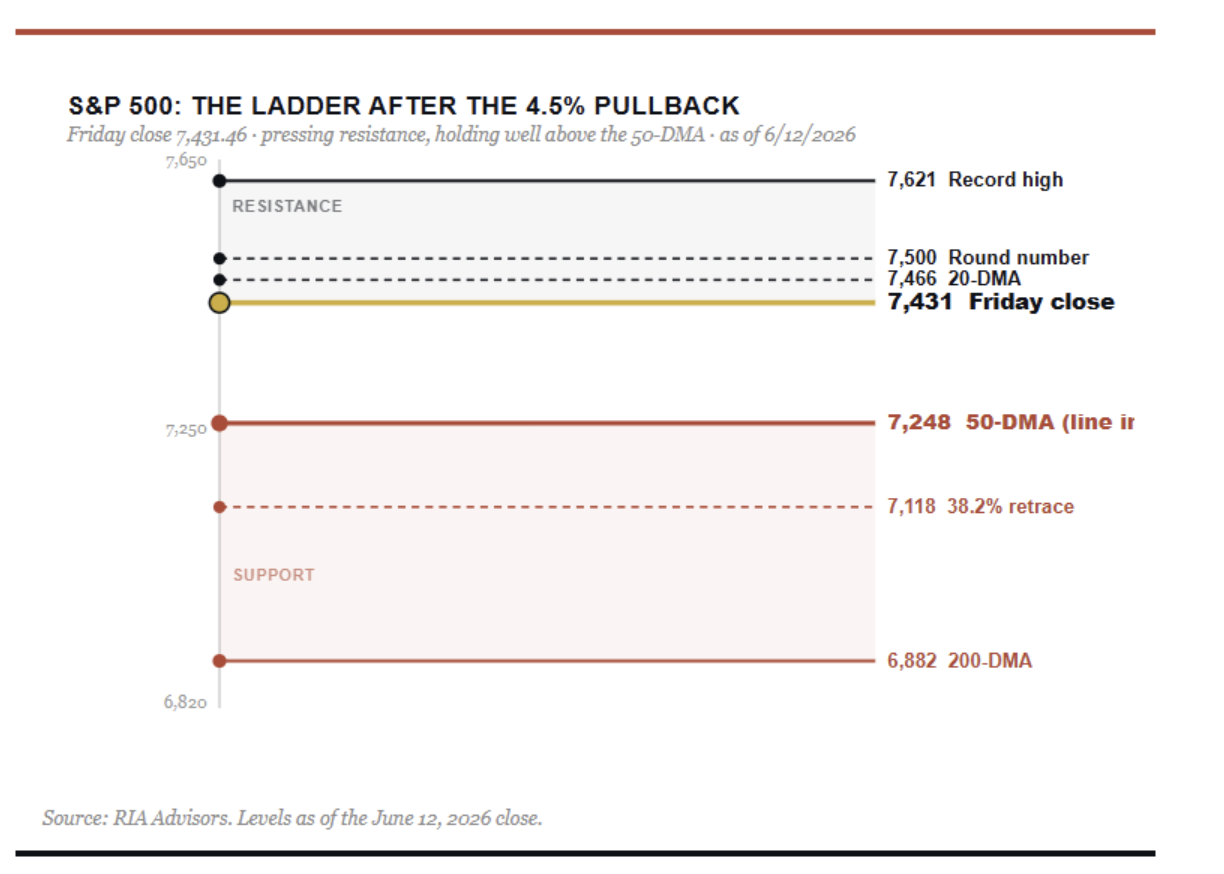
Two weeks ago, after the S&P 500 logged its ninth consecutive weekly gain, we discussed that a bull market pullback was coming. It came. From the May 27 record near 7,621, the index slid 4.5% and bottomed almost exactly on its 50-day moving average before ripping back to close Friday at 7,431.46. That is not the opening act of a bear market. That is the kind of bull market pullback that resets sentiment and, more often than not, clears the runway for the next leg higher. The harder question is what happens after the bounce.
Read more: The K-Shaped Economy: Why The Middle Class Moved Up.
The Correction We Told You To Expect
Make no mistake, I have been warning about the potential for a pullback over the last few weeks and repeatedly discussed taking profits and rebalancing risk. As I wrote in “Two-Month Market Rally: What Comes Next,” a market that climbs for 9 straight weeks gets stretched, and stretched markets tend to mean-revert. The only real questions were the “when” and “how much.” We suggested a bull-market pullback of 3% to 5%; toward the 50-day moving average, would be most likely. However, a larger correction is still possible. As noted, the actual decline ran 4.5% peak to trough and found its floor exactly where trend-followers add rather than abandon.
Notably, the dip buyers showed up on cue. When the S&P probed the mid-7,200s on Tuesday and Wednesday of last week, the same crowd that has bought every dip since the April 2025 low stepped in again, and by Friday the index had clawed back roughly a quarter of the prior week’s 2.64% drubbing. That close at 7,431.46 leaves the larger uptrend fully intact, sitting about 2.5% below the high rather than careening away from it.
Crucially, the setup still favors the bulls, at least for now.
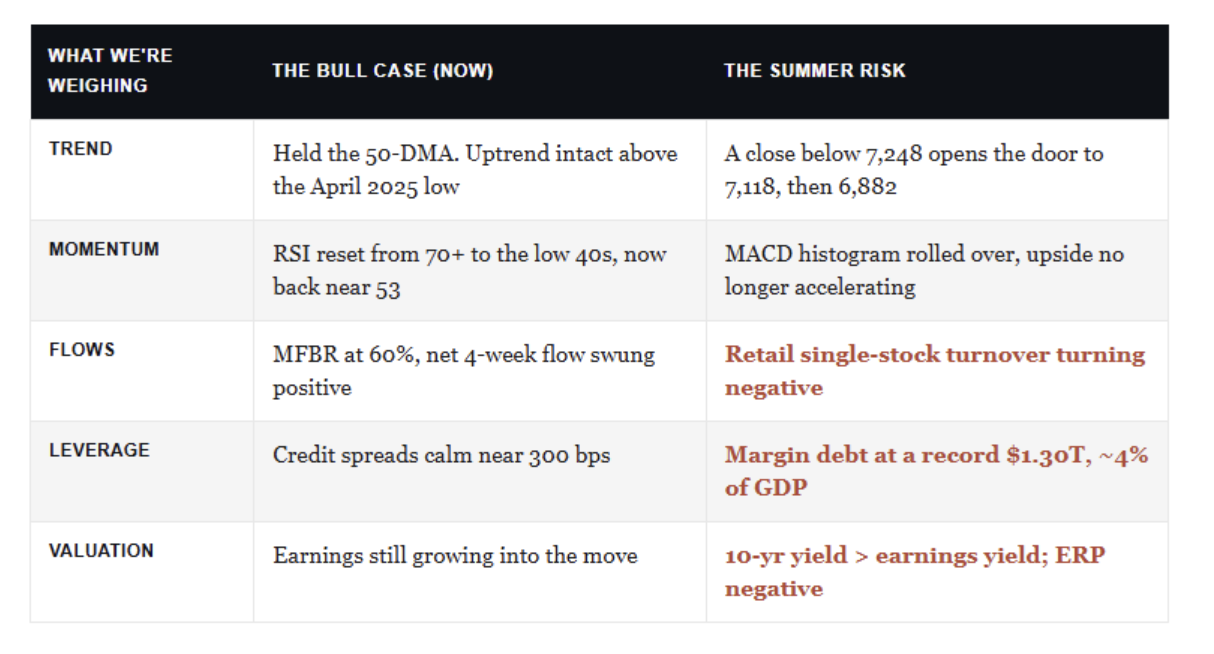
First, the damage was technical, not structural. The 14-day RSI ran above 70 at the late-May high and fell to the low 40s at this month’s lows before settling back near 53. In plain terms, the market burned off its overbought condition without violating the trend, which is textbook.
Second, the quality of the bounce mattered. Thursday’s 1.75% surge came on broad participation rather than three megacaps doing all the lifting, and broad thrusts off support tend to mark real lows instead of dead-cat bounces.
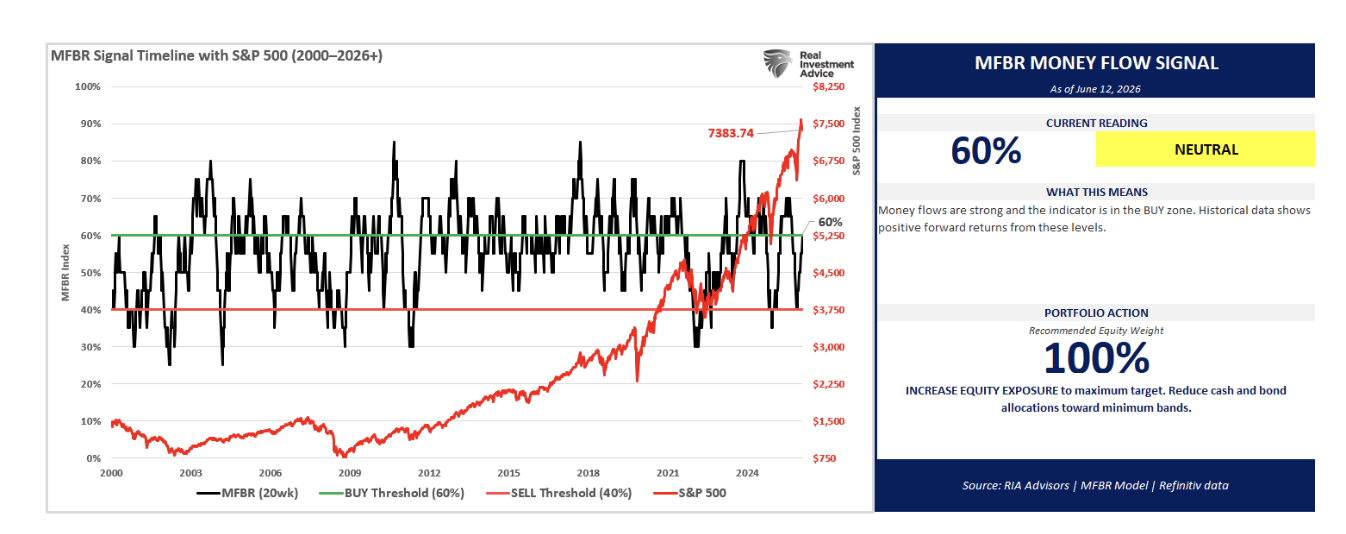
Third, our own money-flow work agrees. The Money Flow Breadth Ratio (MFBR) is a rules-based model that “systematically adjusts portfolio equity exposure in response to the direction and persistence of institutional capital flows.” We use this analysis to size equity exposure in portfolios, and the MFBR ticked up to 60% as of June 12 and sits back in buy territory after sliding to 55% the prior week. The trailing four-week net flow has swung sharply positive following a deeply negative stretch, which historically reads as a contrarian buy. We’ve held exposure at 100% since April 17, and this signal keeps us there.
“As of June 12, 2026, with the S&P 500 at 7,431.46, the Money Flow Breadth Ratio (MFBR) stands at 60% and rising. This places the indicator in BUY territory (60-70%), triggering a NEUTRAL signal. The prior week reading was 55%, representing a 10% decline over the trailing four weeks. The model currently recommends HOLDING exposure at 100%, a level that has remained since April 17, 2026 (8 weeks). This reflects a FLOW-OVERLAY OVERRIDE: the trailing 4-week net dollar flow has swung sharply positive (>$300B) after a deeply negative prior 4 weeks, a historically strong contrarian buy signal.” – Bull Bear Report June 13th
The map from here is simple. Overhead, the 20-DMA at 7,466 is the first hurdle, then the round 7,500 mark, then the 7,621 record. Below, the 50-DMA at 7,248 is the line in the sand, with the 38.2% retracement at 7,118 and the rising 200-DMA at 6,882 beneath it. Hold 7,248 through Wednesday’s Fed meeting, and this stays a routine shakeout inside an uptrend.
What Could Break The Trade This Summer
None of that means you switch off your risk management. As we warned in “Leadership Is Narrow” and again in “Market Correction Risk,” the ingredients for a deeper drawdown are quietly building underneath a rising tape. Three of them deserve your attention.
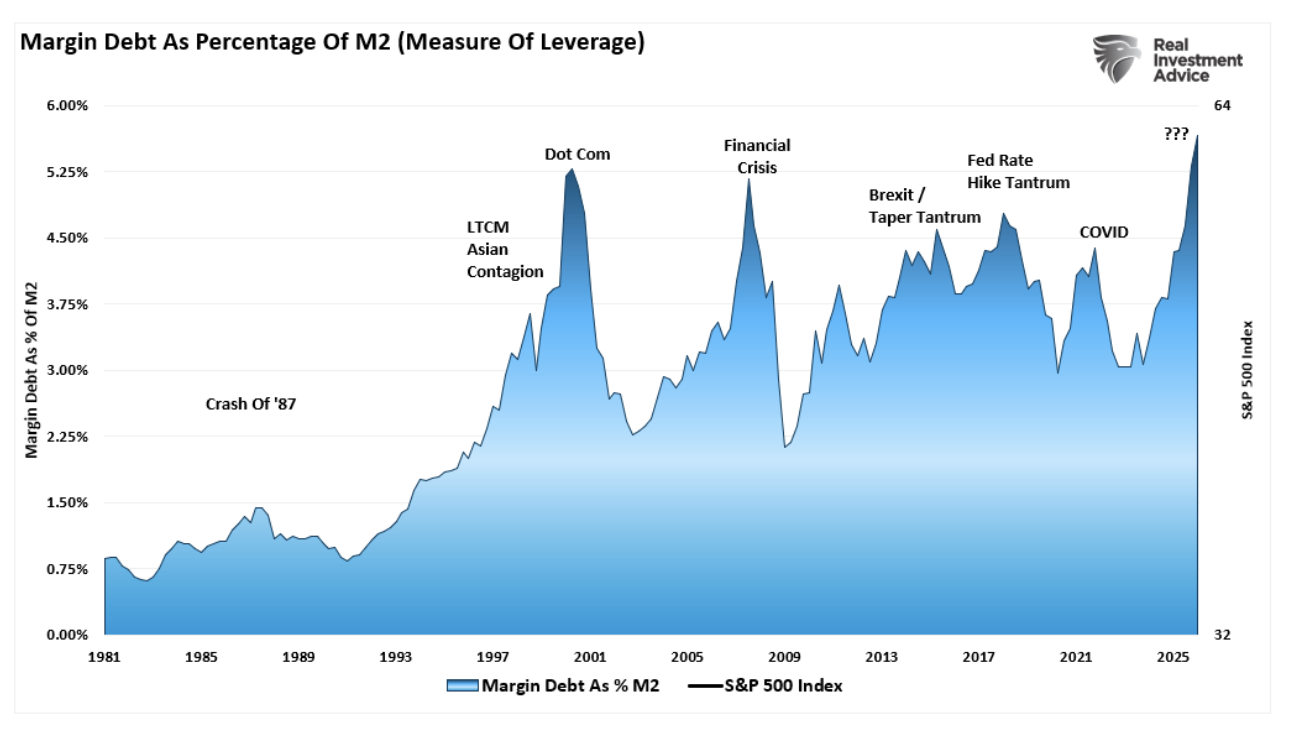
Start with leverage. FINRA margin debt hit a record $1.30 trillion in April, up better than a third in a year, and now runs near 4% of GDP against a long-run median closer to 1.5%. Measured against M2, it’s back near the peaks that preceded the 2000 and 2007 tops. Borrowed money cuts both ways. It is an accelerant, not a cushion.
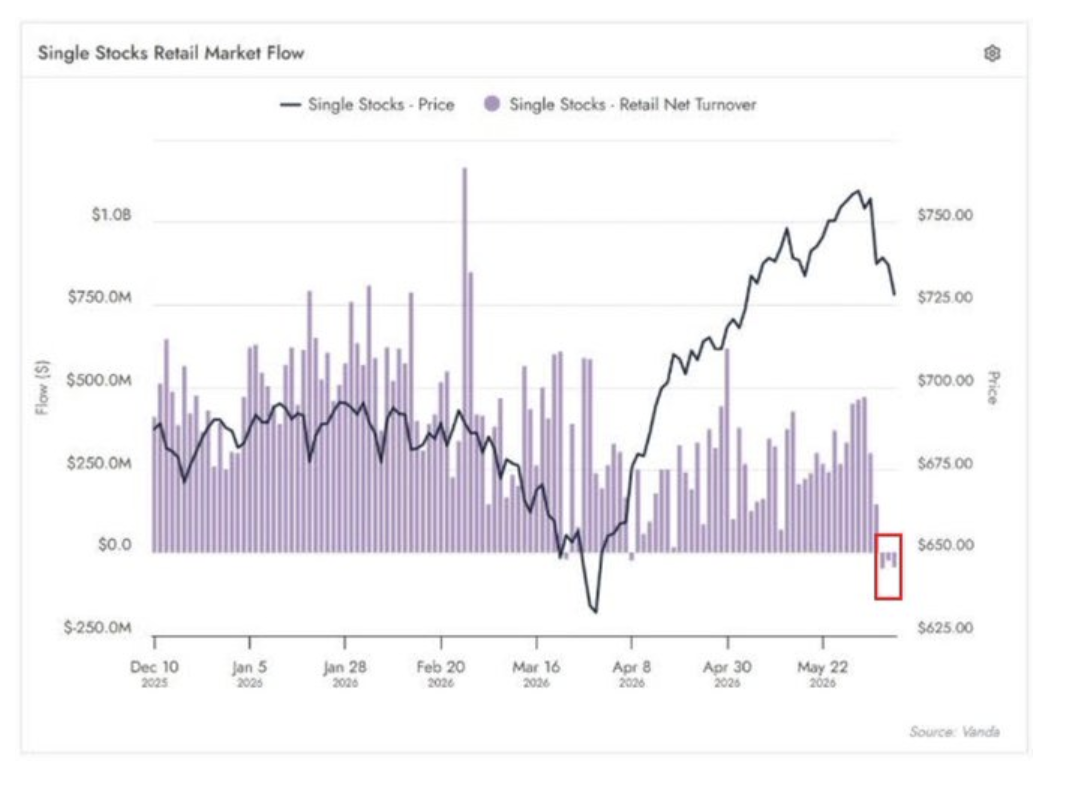
Next, watch the retail bid. Vanda’s flow data shows single-stock retail net turnover rolling over into negative territory in recent sessions, even as prices grind higher. That divergence matters. When the buyer who powered this rally starts selling into strength, the marginal source of demand thins out right as the supply picture gets heavier.
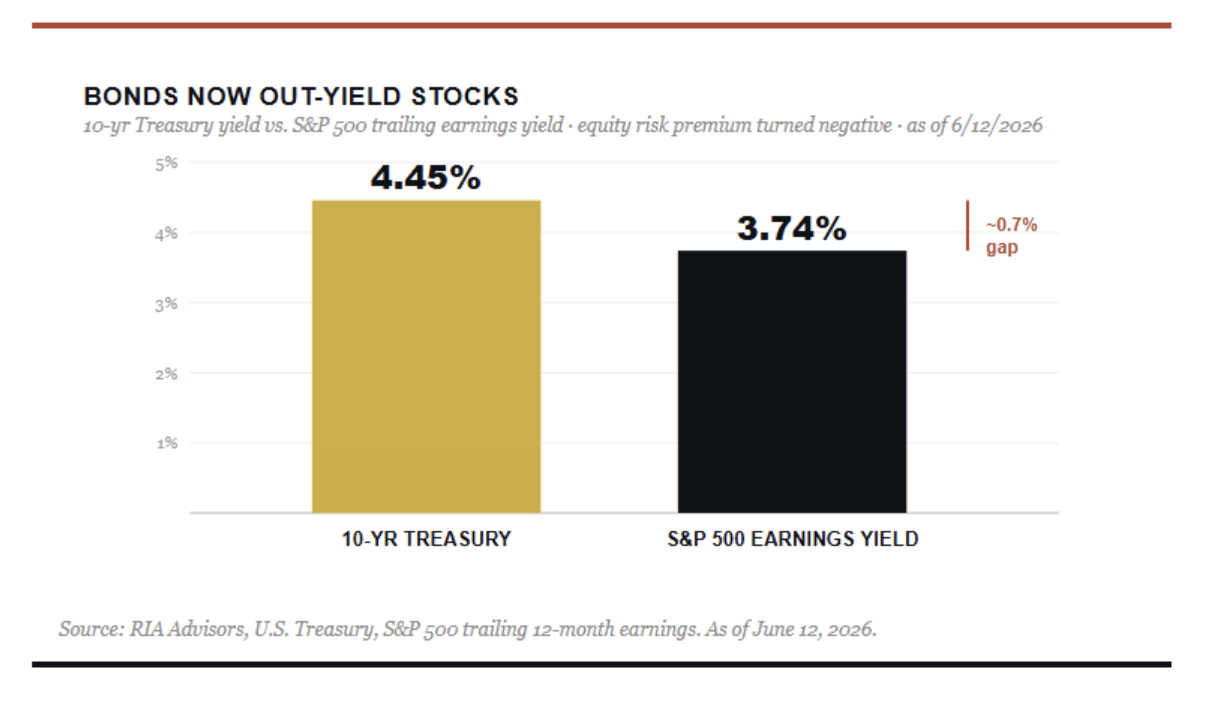
Then there’s the cold math on bonds versus stocks. The 10-year Treasury now yields about 4.45%, while the S&P 500’s trailing earnings yield sits near 3.7%. For the first time in this cycle, a risk-free Treasury pays you MORE than the index earns. That flips the equity risk premium negative and hands every allocator a credible, paid-to-wait reason to trim equities into bonds.
Layer on the supply story as detailed in “Equity Supply Surge”: Alphabet’s $80 billion secondary, SpaceX’s $75 billion IPO, and a queue of mega-raises from OpenAI, Anthropic, and the hyperscalers mean the market has to absorb a wall of new paper. More shares chasing the same dollars is a persistent headwind, not a one-day shock. As we noted in “Parabolic Semiconductor Rally,” when the most prized names all rush the exit at once, it pays to ask who is selling.
How We’re Positioning
So how do we square a buy signal with a real list of worries? We hold exposure and manage risk simultaneously. Those two things aren’t in conflict. The MFBR keeps us invested because the weight of the evidence and a clean test of support still point higher. Bob Farrell’s fourth rule reminds us that exponential moves tend to run further than anyone expects and then correct violently. Markets like that never correct gently. Therefore, we keep trailing stops disciplined, we refuse to chase the SpaceX-fueled enthusiasm at the highs, and we watch 7,248 like a hawk.
The calendar adds a second reason for that discipline. We’re walking into the weakest stretch of the year. As I detailed in “Market Correction Risk: Why Summer 2026 Looks Risky,” the May-through-October window has produced an average S&P 500 gain of just 1.7% since 1950, compared with better than 7% in November through April. The old “sell in May” line gets mocked every spring by people who haven’t looked at the data. The data is one-sided.
Then stack the election cycle on top. 2026 is a midterm year, and midterm years are the weakest and most volatile leg of the four-year presidential cycle. Jeff Hirsch’s Stock Trader’s Almanac has tracked the pattern for decades, and the numbers are sobering. Going back to the early 1960s, the average intra-year drawdown in a midterm year runs around 17% to 18%. That is well above the roughly 13% you see in the other three years. Notably, volatility tends to build up ahead of the November vote as investors handicap the balance of power in Congress.
Here’s the part that keeps me constructive, though. That midterm weakness has historically been a setup, not an ending. The 12 months after a midterm election have delivered an average S&P 500 gain of more than 12%. Furthermore, the Dow has climbed by more than 45% on average from its midterm-year low to its pre-election-year high. So the same seasonal soft patch that turns a routine bull market pullback into a deeper summer correction has, time and again, been the launchpad for the next leg up. We manage risk now, NOT because the bull market is over. We do it because we want dry powder and a steady hand when the seasonal low shows up.
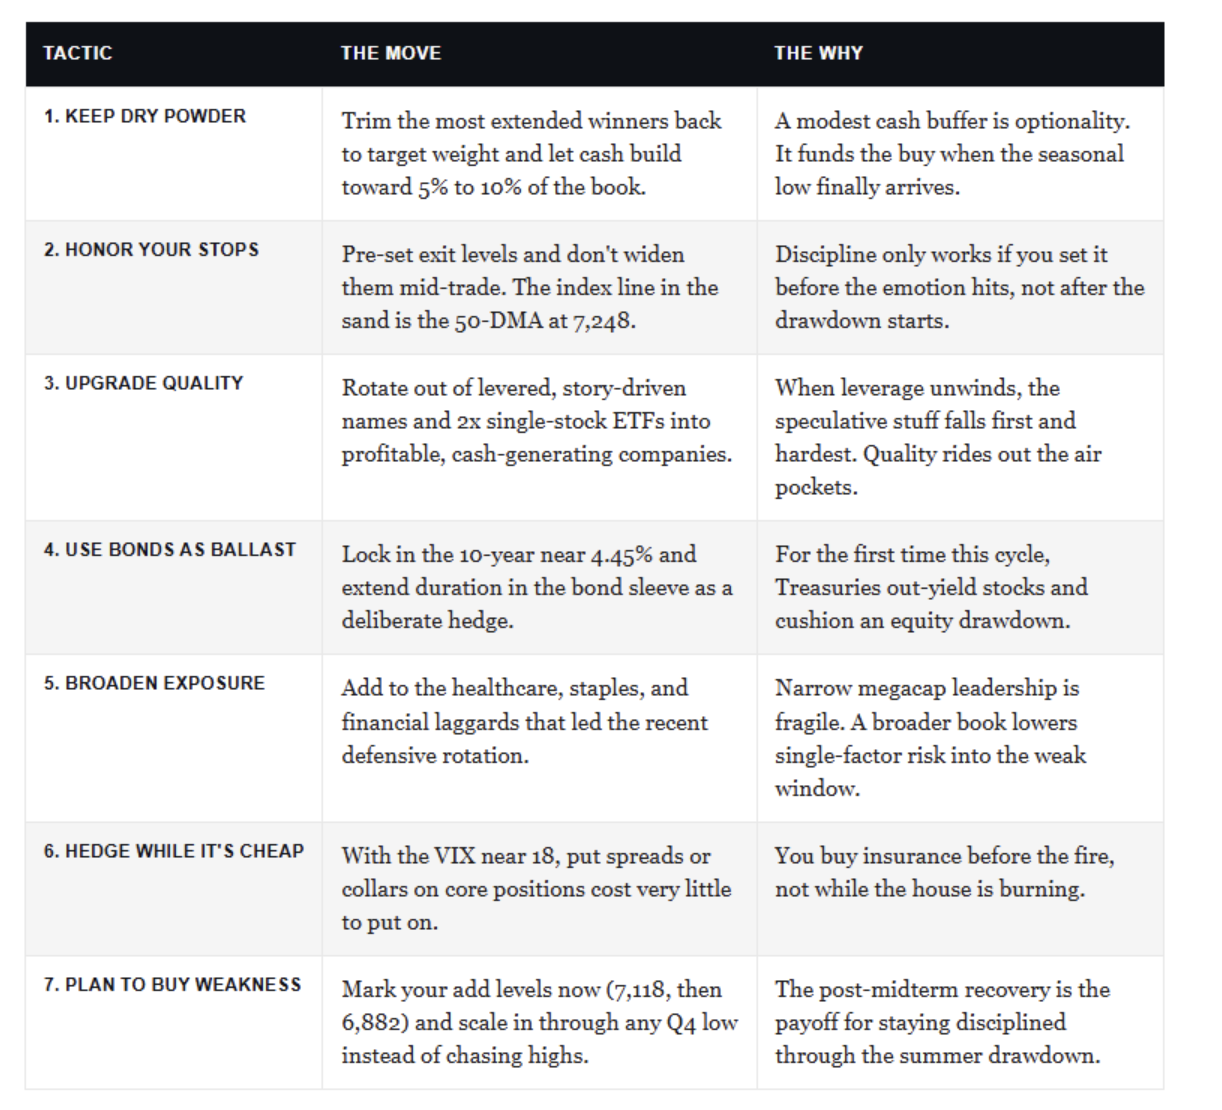
None of this is about going to cash and hiding. It’s about tilting the book so you can sit through a noisy summer and still have ammunition for the fall. Here’s the playbook we’re running.
Howard Marks said it best.
“The riskiest thing in markets is the belief that there is no risk.”
With high-yield spreads pinned near 300 basis points, the market is pricing almost none. That’s exactly the backdrop where this kind of playbook earns its keep. Stay invested, but keep one hand on the exit.
The catalyst that turns a healthy pullback into something deeper won’t be a single oil-soaked CPI print. It’ll be the moment forward earnings expectations start to roll over while valuations sit at the high end of history. We aren’t there yet. Watch the Fed on Wednesday, watch wages, and watch whether second-half earnings estimates hold. The trend is your friend right up until the day it isn’t. Our job between now and then is to stay invested without going blind.
What’s your read? Are you adding to this dip or trimming into strength? Does the gap between a bullish tape and a long list of risks have you second-guessing your own positioning? If so, that’s exactly the conversation worth having. Connect with our team, and let’s pressure-test your portfolio before the summer does it for you.
Sources
- RIA Advisors, “May Inflation Print: Why The 4.2% Headline Is An Oil Story” (Bull Bear Report, June 13, 2026): index levels, 50-DMA, RSI, MFBR reading.
- RIA Advisors, “A Supply Tsunami Is Coming” (June 11, 2026): margin debt, single-stock ETF data, credit spreads.
- FINRA, Margin Statistics: record margin debt of $1.30 trillion (April 2026).
- U.S. Bureau of Labor Statistics, Consumer Price Index, May 2026 release.
- Vanda Research: single-stock retail net turnover.
Lance Roberts is a Chief Portfolio Strategist/Economist for RIA Advisors. He is also the host of “The Lance Roberts Podcast” and Chief Editor of the “Real Investment Advice” website and author of “Real Investment Daily” blog and “Real Investment Report“. Follow Lance on Facebook, Twitter, Linked-In and YouTube Customer Relationship Summary (Form CRS)
Join RIA Advisors and elevate your career within a deeply experienced team focused on innovation. Our collaborative environment is built on a foundation of advanced technology and effective investment models, designed to enhance your ability to serve clients and grow your practice. Benefit from a supportive culture that encourages professional development and fosters a forward-thinking approach. By joining our team, you’ll be part of a group dedicated to excellence and continuous improvement, empowering you to focus on building meaningful client relationships and pursuing your business ambitions. Discover the advantages of working with our accomplished advisory team by starting your conversation today.
A message from Advisor Perspectives and VettaFi: Discover something new! Click here to register for our upcoming webcasts.
Membership required
Membership is now required to use this feature. To learn more:
View Membership BenefitsSponsored Content
Upcoming Virtual Events View All