Behind the Shift Within the FOMC
Membership required
Membership is now required to use this feature. To learn more:
View Membership Benefits
Looking Through Episodic Inflation
Market participants have been conditioned to expect clear Forward Guidance from Fed Chairs and Ben Bernanke, Janet Yellen, and Jay Powell provided it continuously, especially after the Financial Crisis.
The Federal Reserve was established to be the lender of last resort when the financial system becomes unstable, or financial markets plunge so much as to impair the economy. Using Forward Guidance when the financial system is under duress is warranted, since financial markets are reassured that the wheels aren’t going to come off as the Federal Reserve injects liquidity to prevent a systemic breakdown. In the days and weeks after the Financial Crisis, Chair Bernanke and the FOMC post meeting statements assured financial markets that the FOMC would use whatever tool needed to stabilize the financial system. This is why the FOMC launched multiple Quantitative Easing programs (QE1, QE 2, QE3) and kept the Federal Funds rate below the rate of inflation from 2008 through 2014. Monetary policy couldn’t have been more accommodative.
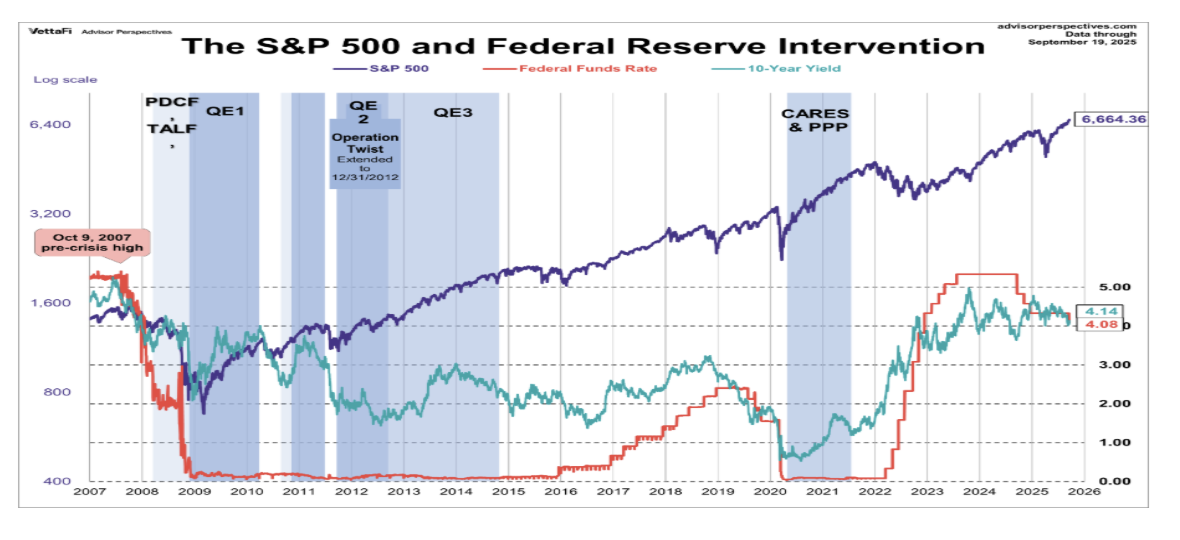
Chairman Warsh has made it clear that Forward Guidance will be less under his leadership, but he has offered a very important qualifier that many have yet to grasp. This is how he described the Forward Guidance provided by the FOMC after the financial Crisis. “Coming out of the 2008 crisis, we were in crisis mode and we were purposely providing a lot of information. Trying to provide a lot of assurance, trying to tell people exactly what we're going to do, offering forward guidance with clarity, as if we're tying our own hands behind our back. Well, in crisis mode, that strikes me as a very prudent policy.” Chairman Warsh has defined when Forward Guidance is necessary and will provide it if the financial system becomes unstable. This straightforward statement ensures that the Federal Reserve will fulfill its commitment of being the lender of last resort under his leadership.
Chairman Warsh has acknowledged that less Forward Guidance will represent a change for market participants and the media, which have become addicted to non-stop hand holding. “Markets and market participants, and reporters, have learned to devour all that information, so I take seriously that the pullback of forward guidance requires some transition. Reform isn't easy, but our general judgment is going to help us make better decisions and in so doing, satisfy our remit.
Chairman Warsh has emphasized that the reduction in Forward Guidance is worthwhile as it will provide FOMC members an important source of information as markets respond to economic data, without first using the FOMC’s Forward Guidance as a filter. Market participants have been trained by ongoing Forward Guidance to react by referencing the Forward Guidance and how the FOMC might respond to the data, rather than processing the new data in a vacuum and doing independent analysis. Chairman Warsh is effectively taking the training wheels off.
“By not spoon-feeding markets, by not previewing our decisions, by not sort of giving nudges and leans, my colleagues and I have found what we're getting is the views from a very accomplished economist. That's the internals of financial markets. Instead of just repeating or echoing what we're saying back to us, they're giving us somewhat, not perfect, their own judgment.”
“Getting a direct message. Letting buyers and sellers meet at prices for Treasuries, for the foreign exchange value of the dollar, and then trying to judge for ourselves, what does that mean about our remit? How are we doing on inflation? How are we doing on employment? We're trying not to interfere with that market signal. That's part of the reason why we've been somewhat spare on our words.”
“Markets can be a very good source of information, not a determinative source, not a perfect source, but if we're trying to land the plane and deliver 2 percent inflation, and we take a very useful source of information and we get it all fogged up by giving it our own forecast, by providing rolling commentary, I can assure you that we're going to have less information, less ability to land the plane successfully, and deliver price stability. We're just trying to make sure that that source of information is as direct and unfiltered as possible.” I’ve criticized the FOMC’s non-stop Forward Guidance for years, and Chairman Warsh is a breadth of fresh air.
As new economic data is released, market participants respond by buying and selling financial instruments. This price discovery reflects what participants think about economic growth, inflation, and whether monetary policy is calibrated correctly relative to the data and trends. The financial markets are casting votes every day, which provides members of the FOMC an ongoing source of information that Chairman Warsh believes will help the FOMC do a better job. At the end of the day, the odds of getting inflation down to its 2% target will be improved.
New Monetary Regime for Persistent Inflation
Chairman Warsh has already reduced the role of Forward Guidance starting with himself. He didn’t provide a Dot for the June or September Dot Plot, and has religiously avoided any hint of Forward Guidance in answering questions during his first two press conferences. After the 5 Task Forces provide their analysis of potential changes, I will be surprised if the FOMC doesn’t discontinue the Dot Plot before the first meeting in 2027. My assumption is that FOMC Board members and District Presidents will not be limited in giving speeches or being interviewed, so this aspect of Forward Guidance will continue.
Comparing the June and September Dot Plot revealed that a significant change took place within the FOMC from projecting no hikes in the Funds rate to supporting multiple increases. “Nine FOMC members in the June SEP didn’t want to increase the Funds rate even once in 2026. In the September 2026 SEP, 12 members projected another hike before the end of 2026, and 4 members said they wanted to hike twice, once in October and December. The shift from 9 members not supporting a single increase in 2026 in June to 16 projecting at least 1 more increase represents a significant shift within the FOMC from just 3 months ago.”
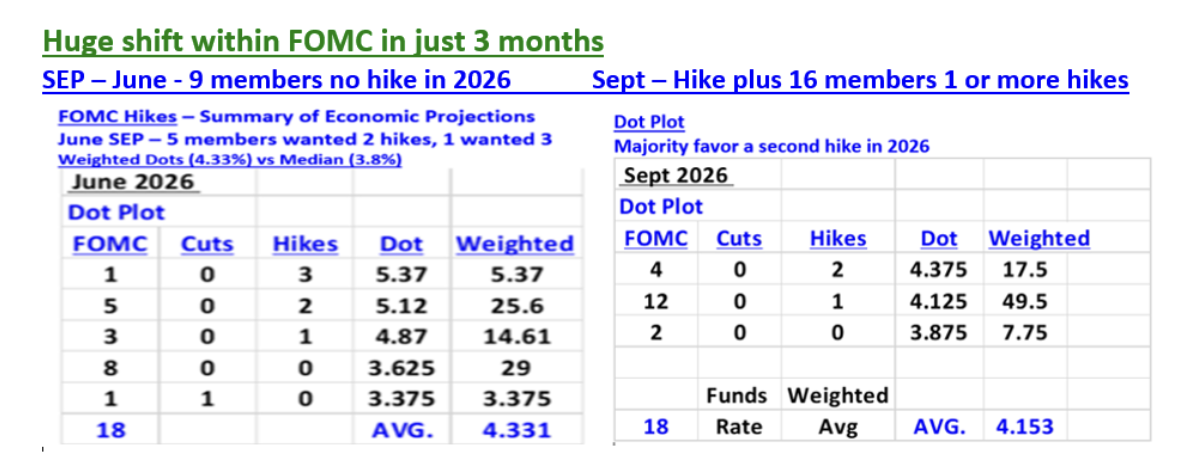
The shift in the center of gravity on the FOMC between June and September was seismic, outside of an event like the Pandemic when the FOMC had no choice but to slash the Funds rate. The question is what caused so many FOMC members to dramatically alter their view on the direction of monetary policy in just three months. Inflation has been above the FOMC’s 2% target for more than 5 years, and looking through inflation as the FOMC has done, has failed to bring inflation down and now the FOMC’s credibility is at risk. The huge shift in perspective within the FOMC suggests that the majority of members have embraced a new approach that emphasizes getting inflation down, even if it means unemployment increases. The Federal Reserve System has been given a dual mandate by Congress: pursuing maximum employment and price stability. For many years however, the FOMC has favored the labor market over inflation in pursuit of its dual mandate. The FOMC has been quicker to lower the Funds rate if the labor market faltered, but delayed hiking even when inflation was above 2%. This shift in emphasis is a big deal.
In this new era of diminished Forward Guidance from the FOMC Chairman, we have to dig deeper and one place to focus on are the speeches by FOMC Board members and District Presidents. On September 22, the President of the Chicago Fed Austin Goolsbee gave a speech that likely captures the new shift in thinking by FOMC members at the September 16 meeting. As such, it’s worth dissecting his speech, since it likely reflects the view of other FOMC members.
Bouts of higher inflation have been driven by a sustained increase in demand relative to supply, or from a supply shock that allows suppliers the leverage to increase prices. Central banks respond to demand shocks differently than to supply shocks.
The FOMC’s playbook for handling bouts of supply shock driven inflation has been to look through them and not lift the Funds rate. This approach was developed after the FOMC aggressively responded to the surge in oil prices in 1973 – 1974 and in 1979 – 1980, leading to deep recessions in 1974 and 1982, and a surge in unemployment (9% in 1975, 10.8% in 1982). (Wage growth also played a role in the 1970’s as union contracts were negotiated with large cost of living increases.) If a supply shock is going to dissipate over time, hiking the Funds rate aggressively isn’t the correct approach, since the lag time between a change in the policy rate and its impact on the economy is 12 to 18 months or longer. By the time higher rates cause demand to weaken, the supply shock is largely over. This mismatch in time is why the FOMC decided to look through the surge in inflation in 2021, as they believed it was caused by a supply shock that was expected to ease quickly.
Chicago Fed President Goolsbee addressed these points in his speech. “Much of this “look through” intuition comes from the historical observation that shocks to aggregate supply have tended to produce more transitory inflation than demand shocks do. Weather events, supply bottlenecks, and oil price shocks often resolve relatively quickly—and even when they don’t fully reverse, they are frequently one-time level shifts rather than persistent inflation shocks. They do not change long-run potential growth, and monetary policy takes months or years to work its way through an economy. So, it’s largely pointless—and prone to timing errors—to use monetary policy in response to something short-lived. Why fight against something that’s going away on its own?”
Austin Goolsbee explained why he now questions the traditional approach of looking through supply shocks. “Normally we think of the central banking challenge of economic stabilization and the business cycle as being about fluctuations in demand. But over the last several years we have lived through a repeated series of supply shocks that have exposed the limits of that thinking and forced new consideration of how central banks should handle supply-side disruptions. Lately, though, we seem to have entered a period where large supply shocks—from wars, tariffs, weather, supply chain disruptions, oil shocks, and so on—have become a regular feature of the economy. Supply shocks have come more frequently, hit harder, and lasted longer. And once supply shocks to inflation become persistent, some of the logic behind “looking through” no longer holds. My argument is that in this new environment, there are some supply shocks that central banks should not simply look through—namely, the persistent ones.”
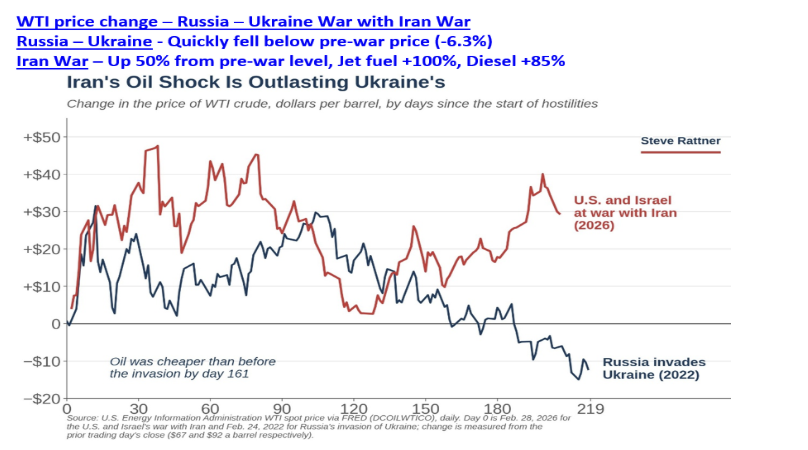
Before Russia attacked Ukraine in February 2022, WTI crude was trading at $88 a barrel in January, and zoomed to $120 a barrel in June 2022. By December 2022 however, WTI was trading at $78.00 a barrel, -11.3% lower than in January 2022. In 2026, WTI was trading at $61 a barrel in January, soared to $111 a barrel in March and the Iran war began, and is trading at $91.00 a barrel, 50% higher than the pre-war price. The oil market rebalanced quickly in 2022 since the disruption to global oil supplies was modest and temporary. The Iran war has created a much larger imbalance that is persisting, and has caused larger price increases for distilled oil products. Since January, 2026 jet fuel is up 100% and diesel fuel is up 85%, which will feed into shipping costs since trucks deliver 70% of all goods. Core inflation measures exclude energy and food prices, but do include the cost of goods, which will prevent Core inflation from falling in coming months. This is likely one reason why more members became worried about inflation.
As Austin Goolsbee noted, inflation has been above the FOMC’s 2.0% target for more than 5 years, and at some point, the FOMC has to deal with that reality, and develop a new playbook to deal with it. “Covid supply chains were supposed to heal within months. When war broke out in the Gulf, futures markets projected oil prices to fall rapidly; months later, oil is still around $100 a barrel and potentially heading higher. Tariffs have been nothing like the stylized textbook example of a one-time price increase—they’ve instead followed a pattern of repeated escalation.”
The FOMC is committed to bringing inflation down to its 2% target in the next two years, but continuing to look through inflation caused by a series of supply shocks has been an impediment to achieving the FOMC’s primary goal. Austin Goolsbee addressed this contradiction. “If a central bank commits to hitting 2% inflation in the medium term and commits to not respond to supply shocks, then a repeated or persistent supply shock to inflation means one of those two commitments can’t hold up. A cost shock that lasts multiple years forces us to revisit the rationale for looking through.”
Before the FOMC’s meeting on September 16, many investment professionals on Wall Street said it would be wrong for the FOMC to increase the Funds rate, since a hike wouldn’t increase the supply of oil, gas, and diesel fuel, or the supply of the most desired computer chips. That’s obviously true, but Austin Goolsbee dismissed that argument. “The central bank still has to restore price stability under its legal mandate—and the only way to bring inflation down is to raise rates and narrow the gap between supply and demand, even if it’s not in the exact same sectors where the cost shocks are occurring.” After more than 5 years of above target inflation, Austin Goolsbee thinks the shot clock has wound down and rate hikes are appropriate, even if they can’t be targeted at the primary drivers of inflation.
Austin Goolsbee differentiated the difference between inflation that is caused by excess demand, relative to supply, and a supply shock which shrinks supply relative to demand. As he noted, monetary policy is directed at regulating demand, as there are no central bank tools that can increase supply. When an imbalance arises with demand outstripping supply, the FOMC increases the Funds rate to cause demand to fall. This comes with the cost of slower economic growth and higher unemployment. As demand weakens, so do price pressures, which brings inflation down over time. “That’s partly a function of the tools the central bank has. Monetary policy works through the demand channel. In principle, the central bank can directly counter a shock to demand that overheats the economy by raising rates—putting supply and demand back into balance.”
Since monetary policy is suited to address demand driven inflation, the standard monetary response to a demand shock is different than prices increases from a supply shock. “Demand-driven overheating has historically built up slowly but persisted much longer—which is why the standard prescription is for monetary policy to respond strongly to demand overheating.”
Since the FOMC doesn’t have the tools to increase the supply of goods and services, the task of reining in a supply shock is more difficult. Nonetheless, the imbalance between supply and demand still must be narrowed, according to Austin Goolsbee. “If inflationary pressure rises from a negative supply shock, the only way the central bank can close the gap is by reducing demand—and, with it, output and employment.”
Whether the imbalance between supply and demand is from too much demand or too little supply, the FOMC has to reduce demand with higher rates. Historically, the FOMC has addressed
demand driven price increases by aggressively increasing the Funds rate, so is an aggressive response appropriate when dealing with supply shock inflation?
Importantly, Goolsbee explained why a supply shock imbalance doesn’t require the same monetary response as a demand driven imbalance. “It’s important to recognize that the response to a persistent cost shock does not need to mirror the response to a demand shock, even for an identically sized imbalance between supply and demand. In the short run, supply shocks force a difficult trade-off for the dual mandate that demand shocks simply don’t. That’s why the central bank may not react as aggressively to a supply-driven imbalance as it does to a demand-driven one.” The good news is the FOMC won’t hike as aggressively in coming months, since it is addressing a supply shock imbalance. However, Goolsbee added a dose of reality, “Our policy response to persistent supply shocks may not need to be as large as it would be if the inflation were coming from demand overheating. But it won’t be painless either. This is exactly the painful trade-off between employment and inflation that stagflationary shocks always impose on a central bank. Unfortunately, in environments like that, the only way back is the hard way.”
The hard way back is allowing the Unemployment Rate to increase without quickly lowering the Funds rate, which is a big change in how the FOMC has operated in the last 25 years. It’s also a willingness to allow interest sensitive sectors like housing to weaken more than they already have, and risk an economic slowdown as consumer rates that are tied to the Funds rate dampen consumer spending.
Further confirmation of Austin Goolsbee’s view will be hearing other FOMC members discussing why they supported the hike at the September meeting, and why they are in favor of additional hikes. On September 22, FOMC Board Governor Michael Barr explained his reasoning. “In my view, given changes to the economy, we were out of position, and we made an adjustment in the right direction. In my base case, further policy adjustments are likely to be needed to ensure inflation comes down to target in a timely fashion. We want to support sustainable, durable growth in support of maximum employment, and price stability is crucial to that.”
This is similar to comments Chairman Warsh made during his September press conference. “On the American people, the least well off are the ones who have the most to gain from stable prices. The decision we made today was the right decision to deliver on the remit that Congress gave us to ensure stable prices. In an environment where inflation is running consistent with our 2 percent objective, offers good news, because that way when they get their wages they can put their head above water and deliver real take-home pay increases.”
Although he is not a voter in 2026, on September 22 Richmond Fed President Tom Barkin touched on some of the same points Austin Goolsbee did. "There was an argument that inflation would return to target on its own, without any additional help from the Fed. One problem with that argument, of course, is that the 'passing' shocks aren't proving to be short-lived, or one-off events. These may pass in time, but I do expect it will take time. In the interim, there is a risk that current elevated levels of inflation could affect future inflation… With inflation more than a percentage point above target, that's a problem."
The CFO Survey is one of the most comprehensive and longest‐running surveys of financial decision-makers. Started in 1996 by Duke University's Fuqua School of Business, the quarterly survey is now conducted in partnership with the Federal Reserve Banks of Richmond and Atlanta. The partnership, which began in the second quarter of 2020, enables Duke and the Richmond and Atlanta Feds to leverage their collective expertise in survey design and data analysis.
The CFO Survey offers insights from business leaders on the financial outlook for their firms, the challenges they face, and their expectations for the economy. The CFO Survey panel includes firms that range from small operations to Fortune 500 companies across all major industries. Respondents include chief financial officers, owner-operators, vice presidents and directors of finance, accountants, controllers, treasurers, and others with financial decision-making roles.
Thomas Barkin noted that the most recent CFO Survey showed firms expect to raise prices by 4.1% next year, more than double the 2019 average. "The net of all this is more inflationary pressure. And that's why we needed to act. We are committed to returning inflation sustainably to our 2% target.”
On September 24, Thomas Barkin participated in a Question and Answer session at the Economic Club of Washington DC. He explained how his views changed over the summer, and hinted he wasn’t the only one looking at developments. “Well, what happened over the summer is I think it just got a lot clearer to me and maybe to others that this gas price thing that was going to endure for a while. We had this Canada tariff thing. The tariff thing's going to endure for a while. The AI build out, this costs—Apple and a bunch of the other chip enabled tech providers raise their prices. So that's going into cost. You could add, by the way, healthcare costs, transportation costs, diesel. There's a lot of things you could throw into the cost base. And so, if inflation's not going to come down relatively quickly, then you have to look in the mirror and say, 'Inflation looks like it's been here for a while, so maybe we should do something about it.' I think that's what happened."
The shift in the center of gravity on the FOMC between June and September was seismic and likely means more rate hikes are coming. The question is whether the FOMC will increase the Funds rate at the next meeting on October 28.
FOMC October Meeting, to Hike or Not to Hike?
In the last few weeks, the probability of the FOMC raising the Funds rate at the October meeting have jumped from less than 20% to 68% on September 28. I don’t think the FOMC will hike at the October meeting, in part based on Austin Goolsbee’s comments. In his speech, Goolsbee explained why a supply shock imbalance doesn’t require the same monetary response as a demand driven imbalance. “It’s important to recognize that the response to a persistent cost shock does not need to mirror the response to a demand shock, even for an identically sized imbalance between supply and demand. In the short run, supply shocks force a difficult trade-off for the dual mandate that demand shocks simply don’t. That’s why the central bank may not react as aggressively to a supply-driven imbalance as it does to a demand-driven one.” A demand shock would call for a series of rate hikes at consecutive meetings, while a supply shock can be addressed with a more measured approach that includes skipping some meetings.
On September 29, New York Fed President John Williams echoed Chairman Warsh’s comments about getting inflation down to the 2% target, supports another hike before year end, but doesn’t think the FOMC needs to be in a rush to hike again. “It is imperative that we return inflation to our 2 percent target on a sustained basis. To do so, we must make certain that adverse inflationary disturbances do not become entrenched, and that any second-round effects on inflation remain muted. With the policy action we took at our September meeting, there is no need for urgency, and we have time to gather more information.”
“The accumulation of more data should provide greater clarity on the underlying trends in the economy and the associated risks to achieving our goals—and thereby the appropriate setting of monetary policy. If the economy evolves in a manner broadly consistent with my forecast, one further upward adjustment of the federal funds target range may be appropriate late this year to support a timelier return of inflation to target. But that is just my forecast, and time—and the totality of the data—will tell.”
In the June Summary of Economic Projections (SEP), 9 FOMC members didn’t want to increase the Funds rate before the end of 2026. Everyone agreed that increasing the Funds rate at the September meeting was appropriate, but some of those who favored no increases in June will likely be sympathetic to John Williams’ view, and vote to wait until December.
A far less important reason why the FOMC won’t hike is that the FOMC meeting on October 28 is just 6 days before the election on November 3. Without compelling justification for another increase so soon after acting in September, the FOMC will choose to wait until the December meeting to make a decision.
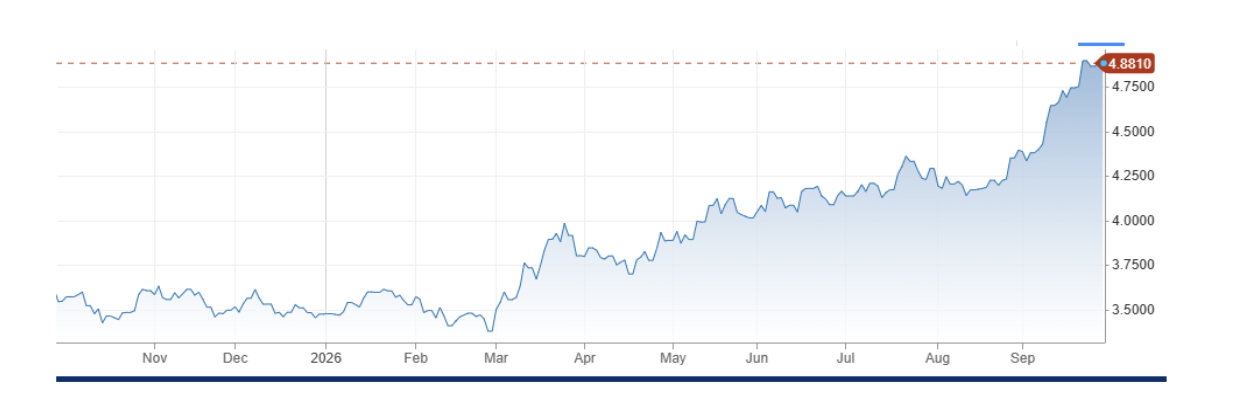
The 2-year Treasury yield leads changes in the Funds rate, and in early August, the 2-year was signaling that a rate hike was coming when the FOMC met on September 16. In contrast, the Funds rate futures were only pricing in only a 32% probability. On October 2, the 2-year was 4.83%, almost a full 1.0% above the current Funds rate of 3.88%. The 2-year yield suggests market participants expect the FOMC to increase the Funds rate 4 times in the next 12 months. I think market participants are getting ahead of the FOMC, so there is a good chance there will be a time when the market participants expect fewer hikes. A downshift in the expected number of hikes would likely help Treasury yields fall, even if it’s just a retracement of the recent surge higher.
2-year Treasury – High 4.96% - 4.88% - Pricing in 4 increases Funds rate – Too much?
AI Demand Shock
The US may be struggling with a supply shock, but there is also a demand shock coming from the historic investment boom related to Super Intelligence (aka Artificial Intelligence after President Trump renamed it). According to Goldman Sachs, AI investment, oops SI investment, will represent 1.9% of GDP in 2026. Notably, the level of investment is going to increase in coming years. According to the Brookings Institution, SI infrastructure spending is projected to total $10.3 trillion from 2025 to 2032. To put this into perspective, AI spending dwarfs what was spent on canals (1836-1841), Electrification (1905-1925), Highways (1956-1973), Telecom and fiber optic expansion (1996-2003), and could be 50% more than Railroads (1870-1890).
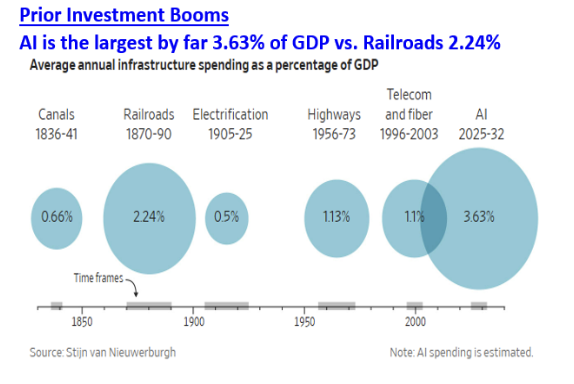
The AI buildout has been getting the attention of FOMC members, who have noted the impact on prices and the wealth it has created. On May 26, Alberto Musalem, St Louis Fed President, said he hasn’t seen evidence that AI is increasing productivity on a sustained bases, but it is lifting prices. “To date, the data are inconclusive about aggregate productivity being in a sustained higher growth regime. However, the demand pressures associated with the AI boom are real. We see them in the data center buildout, the demands for electricity and memory chips, and the buoyant share prices of AI companies that are helping propel consumer spending by increasing household wealth.” On July 12, John Williams said higher interest rates could slow down the rush of spending into the AI buildout, and why the FOMC couldn’t ignore its impact. “The prices of semiconductors and electrical gear, which usually inch along, look like “hockey sticks” on a chart. If this creates a sustained impulse to demand relative to supply and inflation, I do think that’s the kind of situation where you don’t ‘look through. There isn’t much the Fed can do about price shocks from tariffs and oil, but the hundreds of billions flowing into data centers are a continuing source of demand, which interest rates can restrain.”
On July 13, Fed Governor Chris Waller made the connection between AI spending and the historical pattern of lower goods prices offsetting increases in prices for services, and the risk that AI spending could keep the prices of goods from falling. “Another possible source of inflationary pressure is from AI-related demand. This is being reflected in some large price increases on selected goods such as semiconductors, computer chips, servers, computers, and peripherals. While these increases have had a limited effect on overall inflation so far, it is possible they could be a larger factor if the investment surge for AI continues. There are reports that shortages of memory and storage chips and central processing units for servers-all used in ramping up AI capabilities-are driving up prices for retail goods that also use those components. These are goods that, because of ever-improving capabilities, historically saw prices fall and, therefore, subtracted from inflation.”
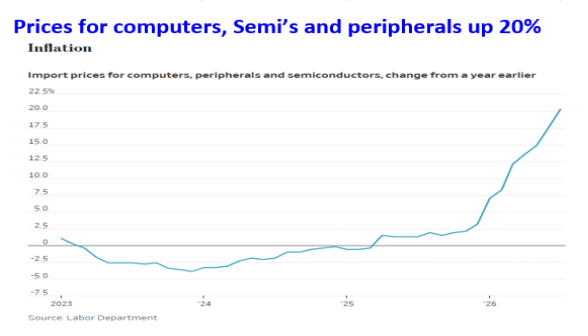
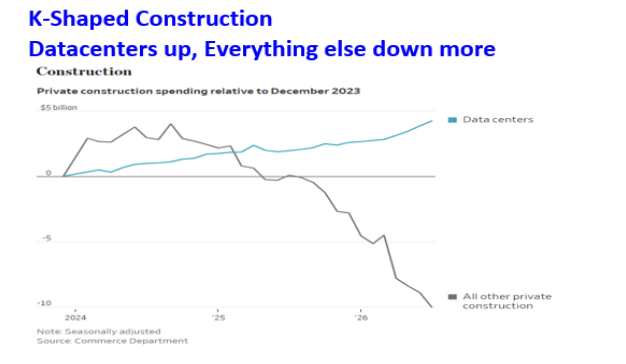
We know that AI spending will continue to soar, so the upward pressure on AI components will remain. The key for the Fed is how long does this last and are firms, not involved directly in the AI buildout, increase their prices to offset higher technology costs they are paying. The outsized contribution from AI spending is masking weakness in all other construction, so the economy’s dependence on AI spending is acute. Non-data center spending has been falling more than Datacenter spending has increased, creating another imbalance within the K-Shaped economy. When AI spending slows, and like all good things it will, the economy will feel the drag from less AI spending. The slowdown in AI spending though is not happening now, which is all equity investors care about.
Economy
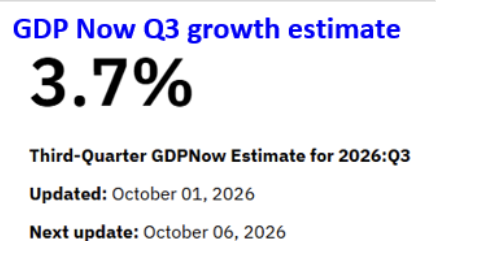
The Commerce Department revised its estimates for economic growth in the first of 2026, with the first quarter bumped up to 2.5% from 2.1%, and the second quarter lifted from 1.5% to 2.2%. Business investment increased 9%, and consumer spending was stronger than originally thought, rising to an 3.8% annual rate in the second quarter, up from 0.7% in the first quarter. Final sales increased by 4.6% in the second quarter from 1.8% in Q1. The positive revisions show that growth is extending beyond AI spending. According to the Atlanta Fed’s GDP Now estimate, growth in the third quarter is running at 3.7%.
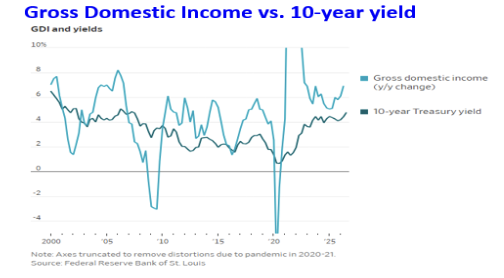
Gross Domestic Product (GDP) measures what the economy produces, and Gross Domestic Income (GDI) measures how much income is generated. GDI includes wages and profits. The Bureau of Economic Analysis (BEA) revised its estimate for GDI up by an annualized $507 billion, so it grew 6.9% over the prior year, versus 6.6% in the second quarter. There is a decent correlation between the rate of change in GDI and the 10-year Treasury yield. When GDI has slumped (economy slowed or entered a recession 2001, 2008, 2020), the 10-year yield has declined. The increase in GDI since 2020 is another reason (along with other more important reasons) why Treasury yields have been climbing.
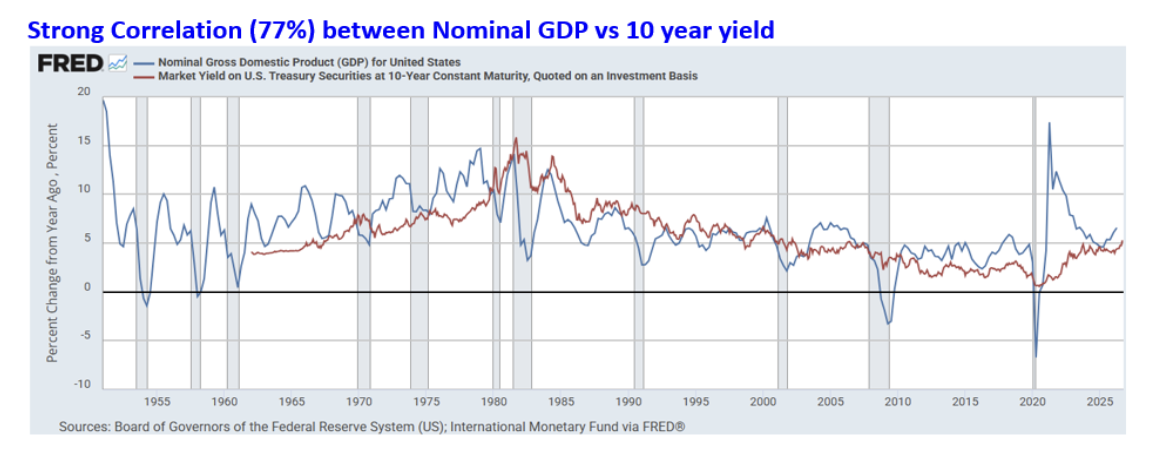
Since 1954, there has been a strong correlation (77%) between Nominal GDP (GDP before subtracting for inflation), and the 10-year Treasury yield. As Nominal GDP grew in the 1960’s and then ramped higher due to inflation in the 1970’s, the 10-year year rose steadily until it topped in September 1981. As nominal GDP trended lower throughout the 1980’s and 1990’s, the 10-year yield trended lower. After the Financial Crisis, Nominal GDP was steady between 4% and 5%, other than a brief blip above 5% in 2018. The FOMC held the Funds rate at 0.12% from 2008 until 2015, inflation stayed below 2%, which helped keep the 10-year Treasury yield low.
Nominal GDP soared after the Federal Government spent several trillion dollars in response to the Pandemic, and then came down to earth as inflation climbed significantly in 2021 and 2022. Importantly, Nominal GDP has held above 5.0% since the second quarter of 2025.
In the second quarter of 2026, Nominal GDP grew by 6.3%. Since the 1950s, Nominal GDP and the 10-year yield have been correlated, and a simple regression maps the 6.3% Nominal GDP growth through the second quarter to a 5.5% yield for the 10-year Treasury yield, and 6.3% GDI growth to a 5.8% yield. Strong growth in Gross Domestic Income and Nominal GDP is one reason why the 10-year Treasury yield has jumped from 3.4% in June to 5.342% on October 2.
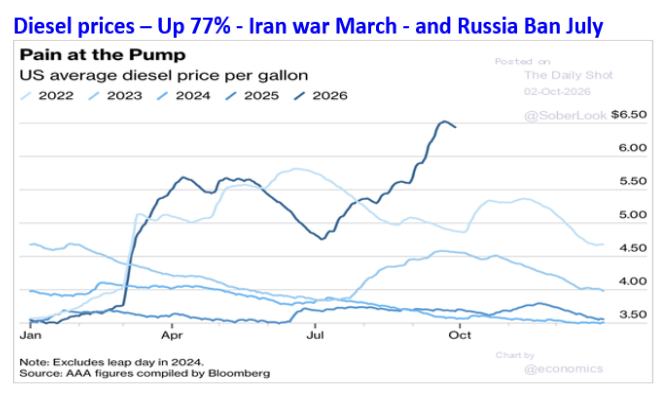
Higher gasoline and diesel fuel prices are more inflationary than an economic drag, especially in the short term. Diesel prices are up 77% in the past year, and shipping rates between Shanghai, and Los Angeles and New York, are up 60%. Railroads have imposed fuel surcharges, parcel-delivery companies such as FedEx, and even the U.S. Postal Service are also raising prices. Costco recently raised the price of its private-label Kirkland motor oil to $58 for 10 quarts, up from $36 on May 30, according to Mizuho Securities.
Before the Iran war began in late February, the average price for a gallon of diesel fuel was $3.60, before jumping to $5.15 in early April. After falling to $4.80 in late June, the cost for diesel has soared to $6.50 a gallon, and more than $8.00 in California. The spike higher since early July is due the ban on diesel exports by Russia on July 8, after Ukraine drones severely damaged refineries. Prior to the ban, Russia was providing 11% of the global supply of diesel, and Russia extended the ban through the end of 2026. Diesel powers 22% of the energy to transport goods, while gasoline is 52%. But the higher cost of diesel is badly hurting farmers, who are getting ready to harvest the crops grown this summer.
The economy is firm, the labor market is stable (September jobs report was fine), but inflation is above the FOMC’s 2% target and inflation pressures aren’t fading anytime soon. Although the FOMC won’t increase the Funds rate at the October meeting, they will hike in December.
Global 10-year Yields
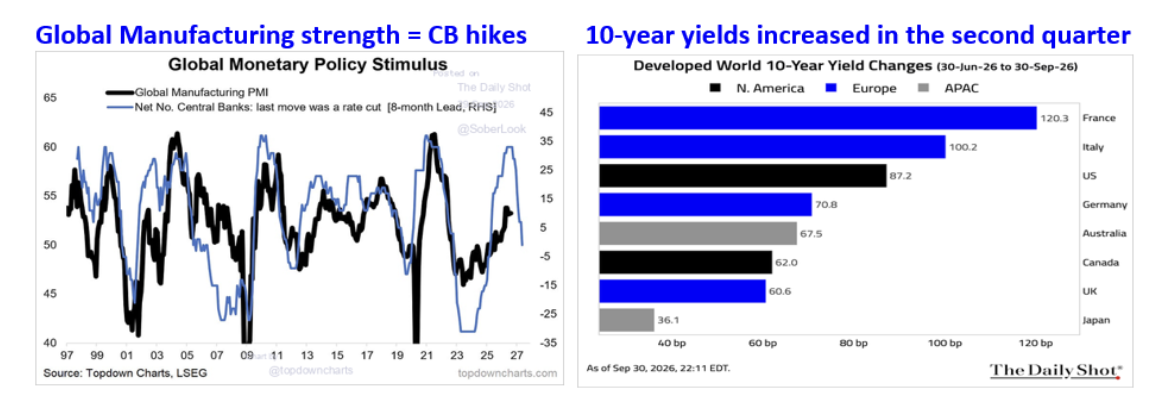
Treasury yields have been ramping higher since June for many reasons. Historically, there is a good correlation between the rate of change in Manufacturing, as measured by the monthly Purchasing Managers Index (PMI,) and subsequent change in Central Bank policy rates 8 months later. After the Global PMI’s declined in 2023, Central banks lowered their policy rate, and hiked as the PMI’s strengthened. The improvement in Global PMIs since 2024 and especially in 2026, indicates that more rate hikes are coming in the next 8 months, as the blue line shows.
Global bond markets are responding to many factors including higher inflation, budget deficits, AI debt financing, and the prospect of central bank rate increases. In the second quarter, 10-year yields went up around the world, led by France (1.235%), Italy, (1.0%), and the US (0.87%).
Treasury Yields
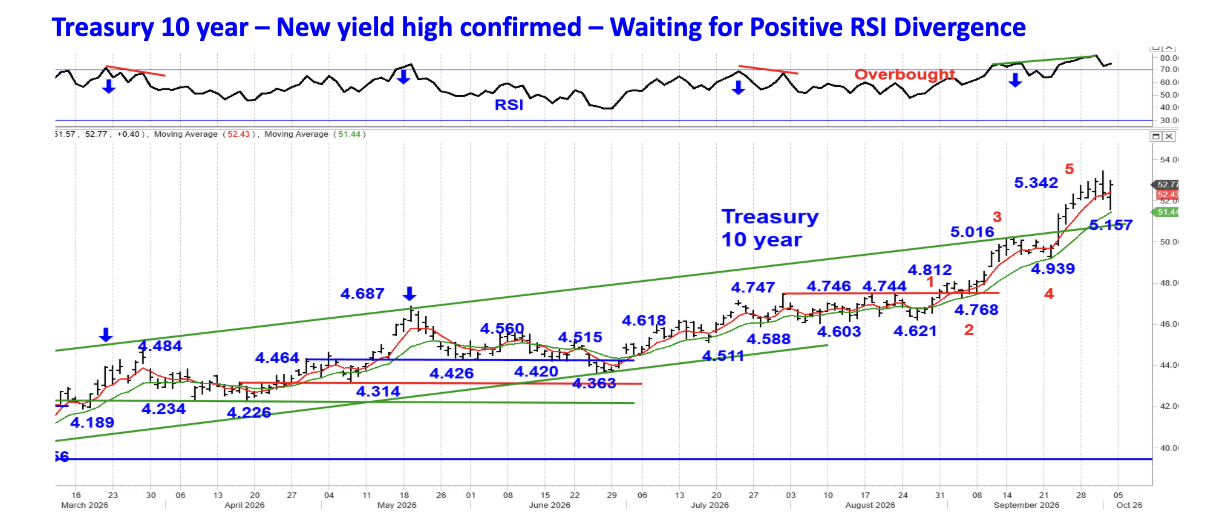
For months, the 10-year Treasury yield was expected to reach 5.0%, which it did on September 16. As discussed in recent Weekly Technical Review’s, the 10-year was expected to trade modestly above 5.016% for Wave 5. A modest higher high above 5.016% was expected to record a Positive RSI Divergence, and set up a nice decline in Treasury yields. That’s what developed in March, May and July, which preceded a drop in the 10-year yield. Unfortunately, that’s not what has transpired.
The 10-year didn’t just post a modestly higher yield above 5.016%, it zoomed to 5.342% on October 1, and its RSI reached 81.3 confirming the higher high. Such a high RSI shows how powerful the move up has been, and indicates that waiting for a Positive RSI Divergence is warranted. On October 2, the 10-year yield fell to 5.157%, after the perceived soft Employment report, before closing at 5.277%. The reversal shows that the Employment report wasn’t as weak as proclaimed in the media, and that sellers are more than willing to sell into any rally.
As noted, market participants are pricing in 4 rate hikes in the next 12 months, which seems aggressive. If correct, a rally that brings Treasury yields down is possible, if market participants lower their expectations to 3 increases from 4. Treasury yields are nearing a high, but we will need to see a Positive RSI Divergence develop, before expecting a reversal in the uptrend.
If a Positive Divergence develops, it could set up a nice decline in Treasury yields. At a minimum, the 10-year is likely to fall to 4.75% (breakout level), with a small chance it could drop to 4.60% – 4.63%. The 30-year yield could fall to 5.10 – 5.15%, and TLT could rally to 84.00 – 84.50.
Stocks
Since 2023, Tech earnings are up a massive 300%, and account for 76% of the increase in earnings in 2026. This is why money continues to flow into the AI related stocks. They are viewed as defensive, since AI spending will continue to zoom no matter what happens to interest rates.
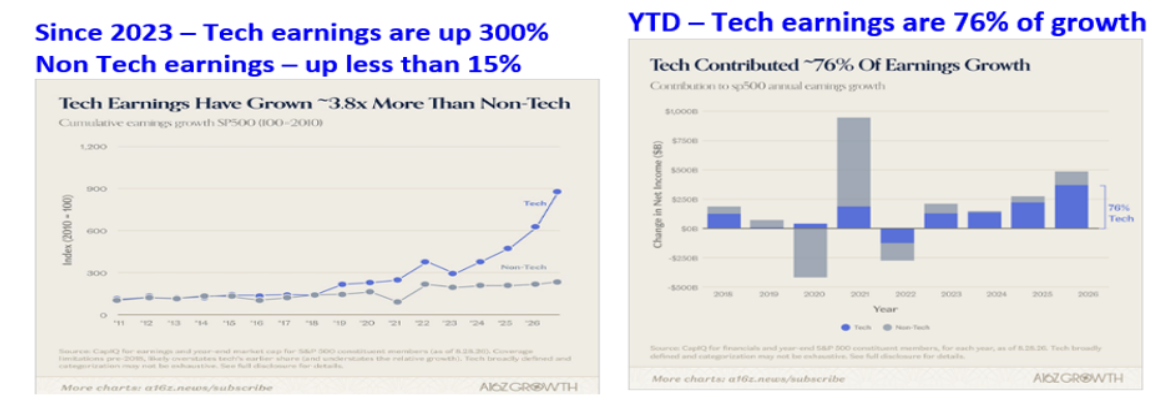
Since 2023, non-Tech earnings are up less than 15%, and with more FOMC rate hikes coming and higher Treasury yields, investors haven’t been willing to buy non-Tech stocks. Investors view the big gain in earnings and expected earnings as an insurance policy. If earnings continue to soar, the valuation of Tech stocks improves (P/E ratio), so future earnings act like a put option should these high growth stocks decline. According to Citadel, Microsoft (MSFT), Nvidia (NVDA), Apple (AAPL) and META (META) alone added about 300 points to the S&P in the third quarter, while the other 496 stocks together subtracted about 150 points.
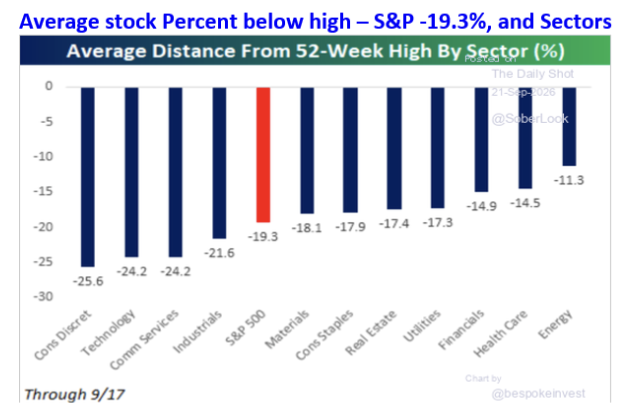
Although the S&P 500 has held up well since mid-August in the face of much higher Treasury yields, a FOMC rate hike, and elevated oil prices, the broad market has been under significant pressure. A breakdown within each of the 11 sectors in the S&P 500 provides an even better look at how broad the weakness has been. These figures are from September 17, and many of these sectors are still lower on October 2 than they were on that date. The average decline for the stocks within the Consumer Discretionary sector is -25.6%, with the average Energy stock down -11.3% from its high. Incredibly, the average stock within the S&P 500 is down -19.3% from its high. The S&P 500 Index may be down just -2.0% from its high, but that figure is masking an enormous amount of weakness lurking under the surface. This data shows the ‘market’ has been anything but resilient since mid-August in the face of higher Treasury yields and a more Hawkish FOMC policy.
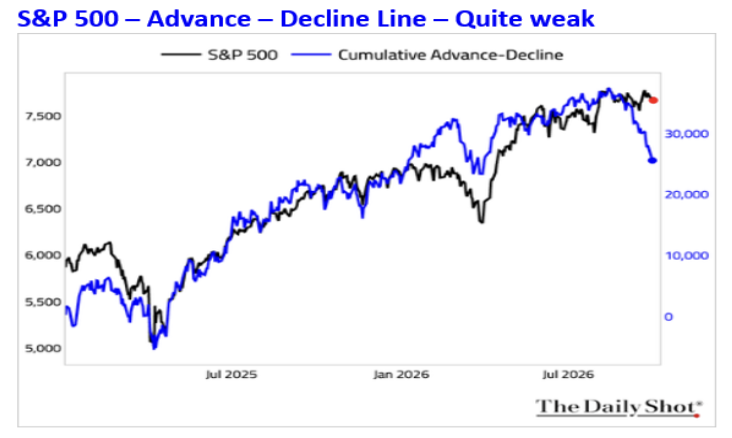
The Advance – Decline Line reflects the weakness that has developed since mid-August. When the A-D Line was this weak in February and March in 2025, the S&P 500 fell -21%, and shed -10% in February and March in 2026. The S&P 500 is less than 2% from its high, but the majority of stocks are down about -19%. The narrowness of the strength in the S&P 500 isn’t healthy, but until that changes, the S&P 500 can continue to avoid a decline. However, if the Mag 7 stocks and Semiconductor stocks falter, the broad market isn’t likely to provide enough support, especially if yields push higher.
In July 1987, the 10-year Treasury yield was 8.30% and in October it was 10.2%, an increase of 22.9% in about 15 weeks. The surge in Treasury yields was one reason why the stock market plummeted by more than -30% after topping on August 25, 1987 culminating in a Crash of -22% on October 19, 1987. The Crash caused a flight to safety, and the 10-year Treasury yield fell to 8.78% on November 12, 1987. In June, the 10-year was 4.40%, and an increase of 22.9% would lift it to 5.40%. On October 2, the 10-year reached 5.34%, which helps explain why the broad market has been so weak. In mid-August 2026, the 10-year Treasury yield was 4.6%, and a comparable increase of 22.9% would find the yield at 5.65%. If the 10-year yield reaches 5.65%, the Mag 7 and Semiconductor stocks might actually decline! Until the 10-year yield tops and reverses lower, this is a risk. Interestingly, the FOMC increased the Funds rate in September 1987, which rhymes with the hike in September 2026.
The US blockade of the Strait of Hormuz is working since Iran wasn’t able to get a single oil tanker out in the month of September. In addition, the amount of oil flowing out through the Strait of Hormuz is about 90% of pre-war levels, and Saudi Arabia has repaired the East – West pipeline. This means Iran’s leverage is melting away and their access to cash flow is being deprived. When a wounded caged animal is cornered it will often lash out, which Iran may choose to do by damaging as much oil infrastructure in the Middle East as possible. This is a risk for the stock market, because even the AI stocks would get caught up in the subsequent decline and make it deeper.
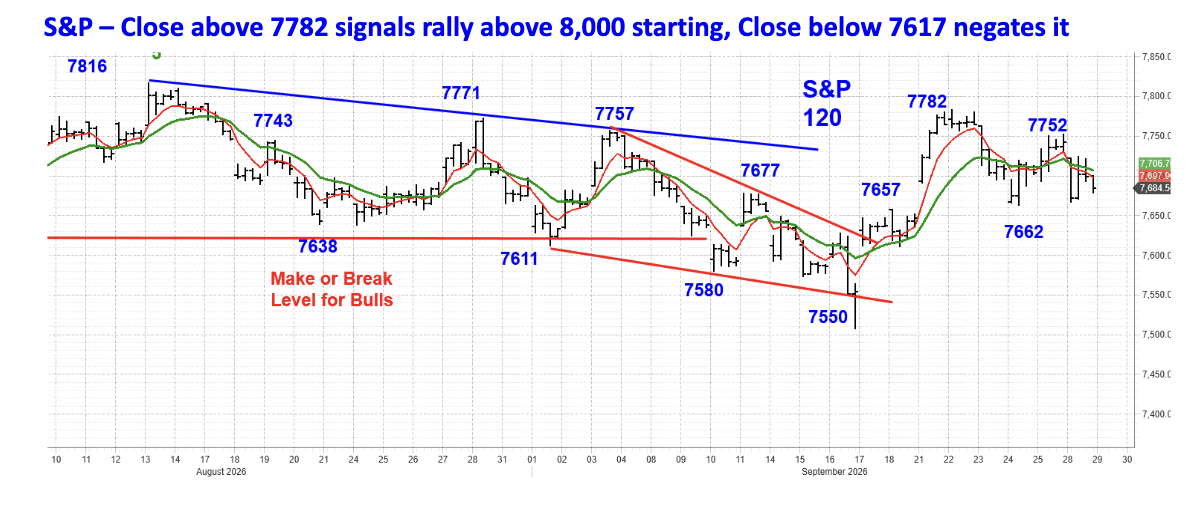
If Treasury yields decline in coming weeks, without climbing to 5.65% first, the broad market will get a nice lift, since it is quite oversold. This is why a rally to 8,000 or higher is possible, since the Mag 7 stocks and Semiconductors stocks have higher targets as discussed in the September 21 WTR. “The breakout in the Mag 7 could lift it to 80 – 82. The Semiconductor ETF SMH rallied from 503.63 to 600.37. An equal rally from 537.73 would target a rally to 634.” SMH reached 636.25 on October 2, so it has potentially completed an a, b, c rally from 503.63. A close below 591 would be bearish. Mag 7 has yet to get into gear, and a close below 70.43 would be negative. If Treasury yields keep moving higher, the rally could end abruptly, and called into question if the S&P 500 closes below 7617. A close above 7782 will signal the rally to 8,000 is starting.
Dollar
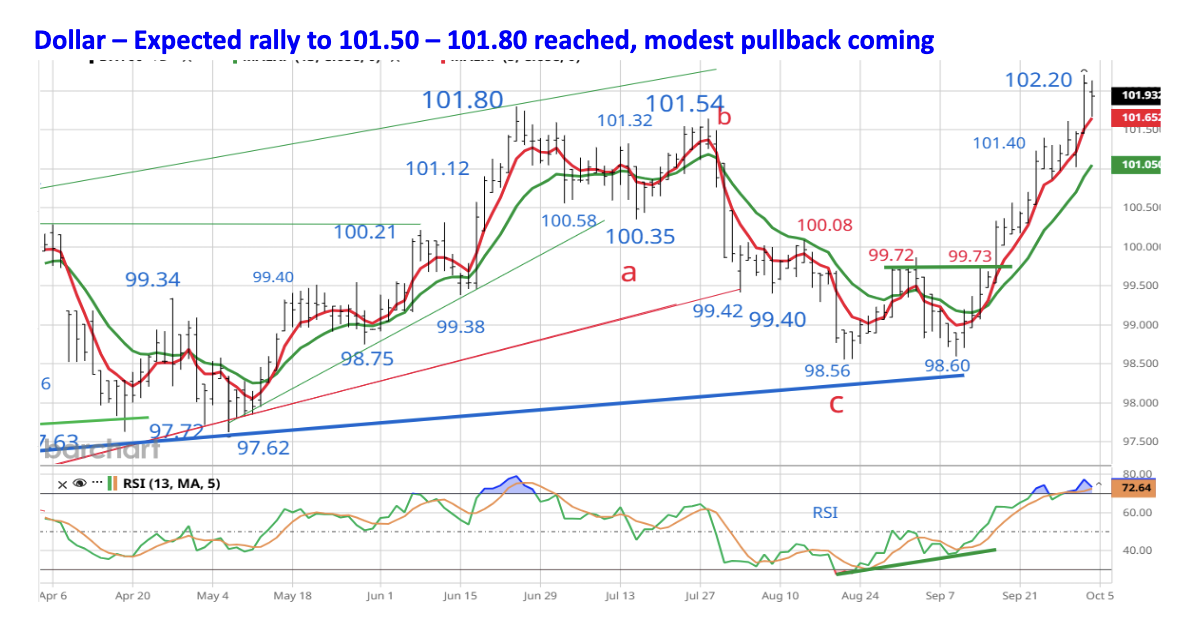
The Dollar’s RSI generated a Positive Divergence when the Dollar made a lower closing low on September 8, and its RSI was 38.2 versus 28.1 when the Dollar closed slightly lower on August 21 (green line on RSI lower panel). As noted in the September 21 WTR, “Given the shift within the FOMC with 16 of 18 FOMC members favoring at least another increase before the end of 2026. The Dollar should follow through to the upside and approach 101. 50 – 101.80 in coming weeks, as FOMC members express Hawkish views.” On October 1, the Dollar reached 102.20. Although the Dollar’s RSI is overbought (>70), it looks like it will have a push above 102.20, before a pullback (100.50 – 101.00) begins. Longer term, the Dollar is expected to rally to 105.00.
Gold
In the September 21 WTR, I provided key price levels. “If Gold closes above 4399, a rally above 4510 is likely, conversely, a decline below 4234 would set up a drop to near 4100, or lower.” On September 28, Gold traded below 4234 and dropped to 4111 on September 28, and Gold’s RSI fell to 34.1.
After topping at 4696 on August 25, Gold declined $585, or -12.5%. So far, the bounce has been pathetic, and it looks like an a, b, c counter trend move. This suggests Gold will likely fall below 4111, and could possibly take out 3945, if the Dollar keeps moving higher.
If the Dollar records a short-term high soon, Gold could dip under 4111, and then launch a better rally. I think this is more likely. If correct, Gold would retrace a portion of the recent decline. The 50% retracement of the drop from 4696 to 4111 is 4403, and the 61.8% target is 4472. If Gold follows this script, it will drop below 3945 and likely fall to near 3500 or lower by mid-2027.
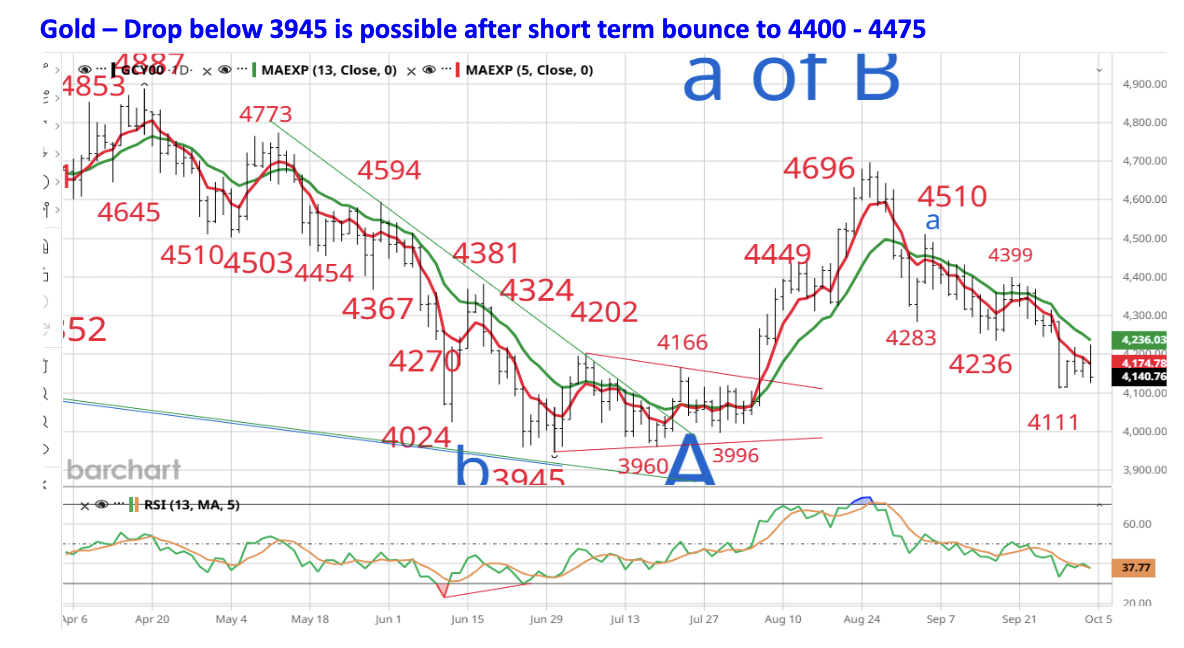
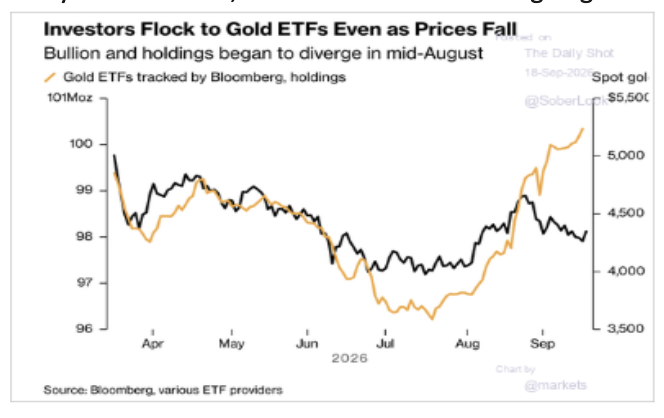
A drop to 3500 may seem extreme, especially to Gold bulls, but consider this. One big negative is that money flows into Gold ETFs have been strong, which sounds counter intuitive. Why would buying be negative? Positive money flows sure sound positive, except it is irrational when for people to buy, as Gold was falling by more than -10%. This shows that there is a lot of bullish sentiment, with buyers so sure another big rally is coming they want to buy, irrespective of the near term trend. This is not supportive of a sustained rally from current price levels. Gold could rally to 4400 – 4475, but a sustained rally above those levels isn’t likely. It’s possible that Gold could drop below 3945, before a solid intermediate trading low is established. Bullish sentiment would decline on a drop below 3945, and Gold’s RSI would become fully oversold.
Gold Stocks
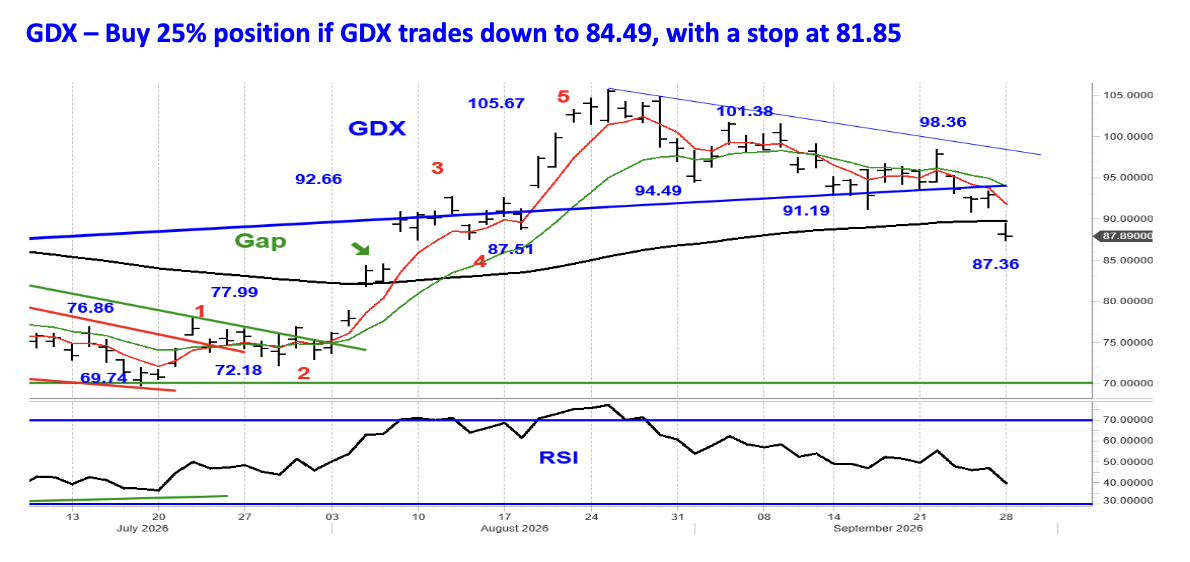
If the Dollar registers a short term high soon, that could allow Gold to rebound in the next few weeks. GDX can be expected to participate. GDX’s RSI is down to 41.0, so it’s not quite oversold, and there is a gap at 84.48 from August 6. The 61.8% retracement of the rally from 69.74 to 105.67 is 83.46, so the range between 83.46 and 84.48 is a good place to take a shot. Buy a 25% position if GDX trades down to 84.49, for a quick trade to 95.00 if Gold rallies. Use a stop at 81.85.
Major Trend Indicator
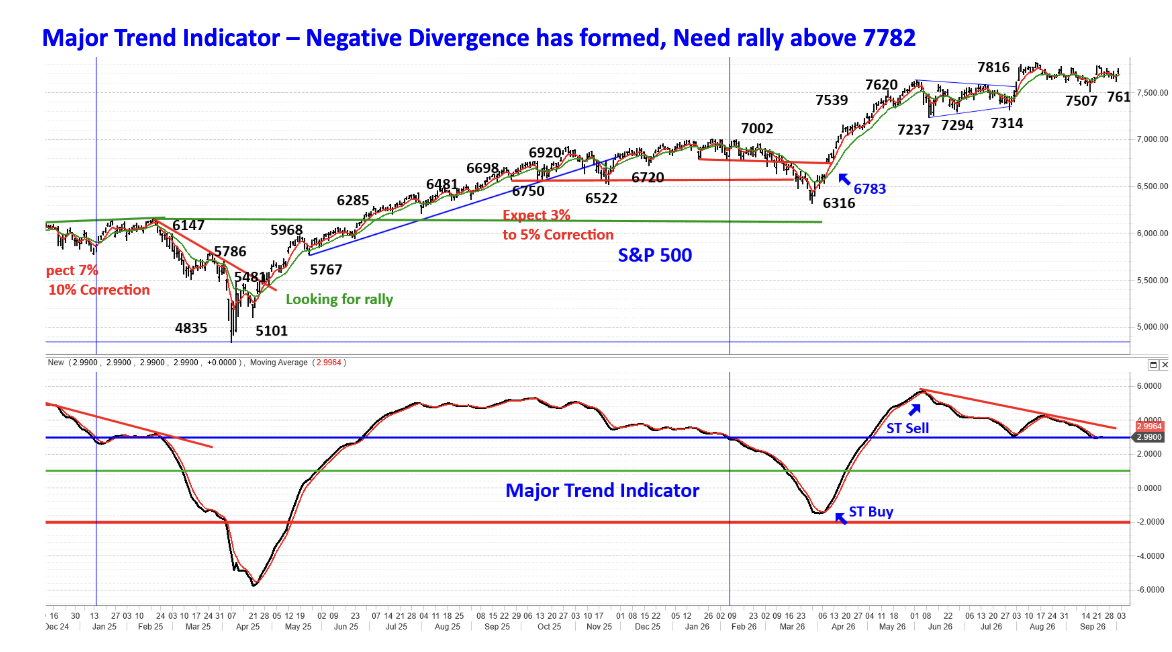
The red line on the MTI is a short term moving average and provides a short term buy signal when the MTI crosses above it after being below the green horizontal line. On April 8 the MTI closed above the moving average and generated a short term buy signal when the S&P 500 closed at 6783.
On April 20, the MTI crossed above the green horizontal line which is the first indication that a new bull market had begun. The MTI closed above the blue horizontal line soon on May 4, which is normally a confirmation that a new bull market has begun. As long as the MTI is above the blue horizontal line, we’re in a healthy bull market. (The blue line is at 3.00) As of September 8, the MTI was 3.68.
The MTI closed below the red moving average on August on August 21. I expected a correction before the rally to above 8,000 commenced, and as discussed, the broad market has experienced a meaningful correction. The MTI didn’t provide a short term buy signal this week, and the MTI is holding at the blue horizontal line.
Prior to the declines in 2025 and 2026, the MTI declined below the blue horizontal line (vertical blue lines), before the declines began. When the S&P 500 made a new high in February 2025, the MTI recorded a much lower high, even though it was near the blue horizontal line. When the S&P 500 made a new high in August 2026, the MTI was well below the high in May 2026.
This is a Negative Divergence, and given how weak the broad market has been since mid-August, the MTI is also signaling vulnerability. Pretty much the only the glue holding the market together is the Mag 7 and Semiconductor stocks. This is not a low risk market, unless Treasury yields reverse lower. A decline to 7214 or 7066 in the S&P 500 hasn’t been eliminated.
If the S&P 500 can close above 7782, the MTI will likely generate a short term buy signal, once the MTI crosses above the red moving average. A close below 7617 would negate the rally potential.
The Daily Shot A number of charts in this letter were from The Daily Shot.
Jim Welsh
@JimWelshMacro
[email protected], MacroTides.com
A message from Advisor Perspectives and VettaFi: Discover something new! Click here to register for our upcoming webcasts.
Membership required
Membership is now required to use this feature. To learn more:
View Membership Benefits