The risk of Fed over-tightening rises when 5% Treasury yields, a thin savings cushion and a hike-cut-hike Fed all converge at the same time.
The Fed raised rates in September, and the 10-year Treasury yield has since topped 5.3%, the highest since 2007. That combination raises a question the market isn’t asking loudly enough. If long-term rates are already doing the tightening, does every additional hike from here raise the risk of Fed over-tightening? I think the answer is yes. What’s more, the data suggest the “runway” before the damage shows up is shorter than most assume.
On September 16, the FOMC voted 12-0 to raise the target range to 3.75%-4.00%, its first hike since 2023.1 The new dot plot puts the year-end rate between 4.1% and 4.4%. Markets now expect a hold at the October 28 meeting but still price roughly three-in-four odds of another hike by December.2 As I argued in why the Fed rate hike won’t fix the inflation it targets, the Fed’s tool works on demand and only demand. So the real question is where that demand is most exposed. Let’s take it in four steps.
Is Strong Economic Activity Really Driving Inflation?
Start with the activity data, because it’s genuinely strong. The ISM Services PMI printed 54.9 in September, with new orders at 59.8, while the manufacturing index came in at 54.5.3 Weight those 80/20 to reflect the economy’s services tilt and you get a composite of roughly 54.8. If activity drives inflation, readings like that should precede hot CPI prints.
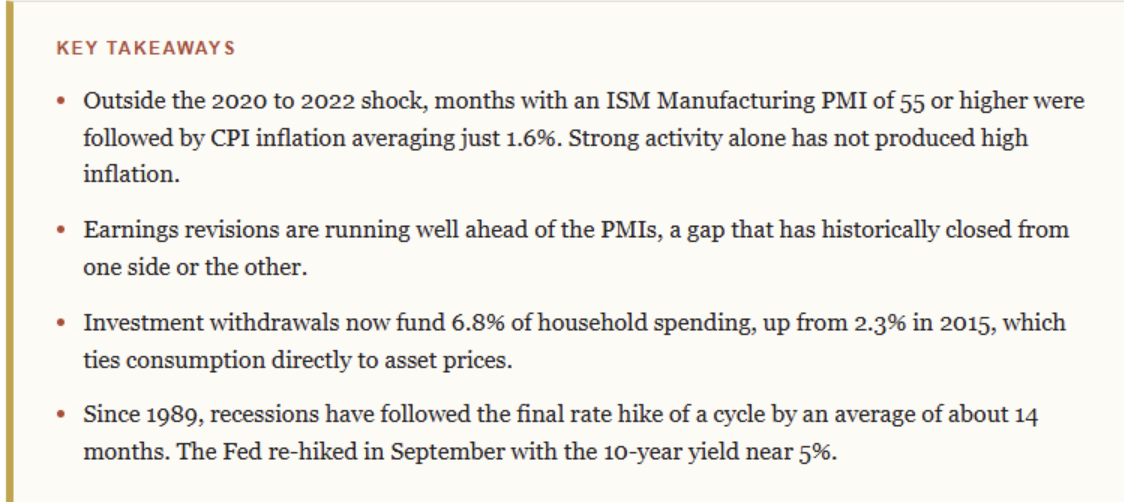
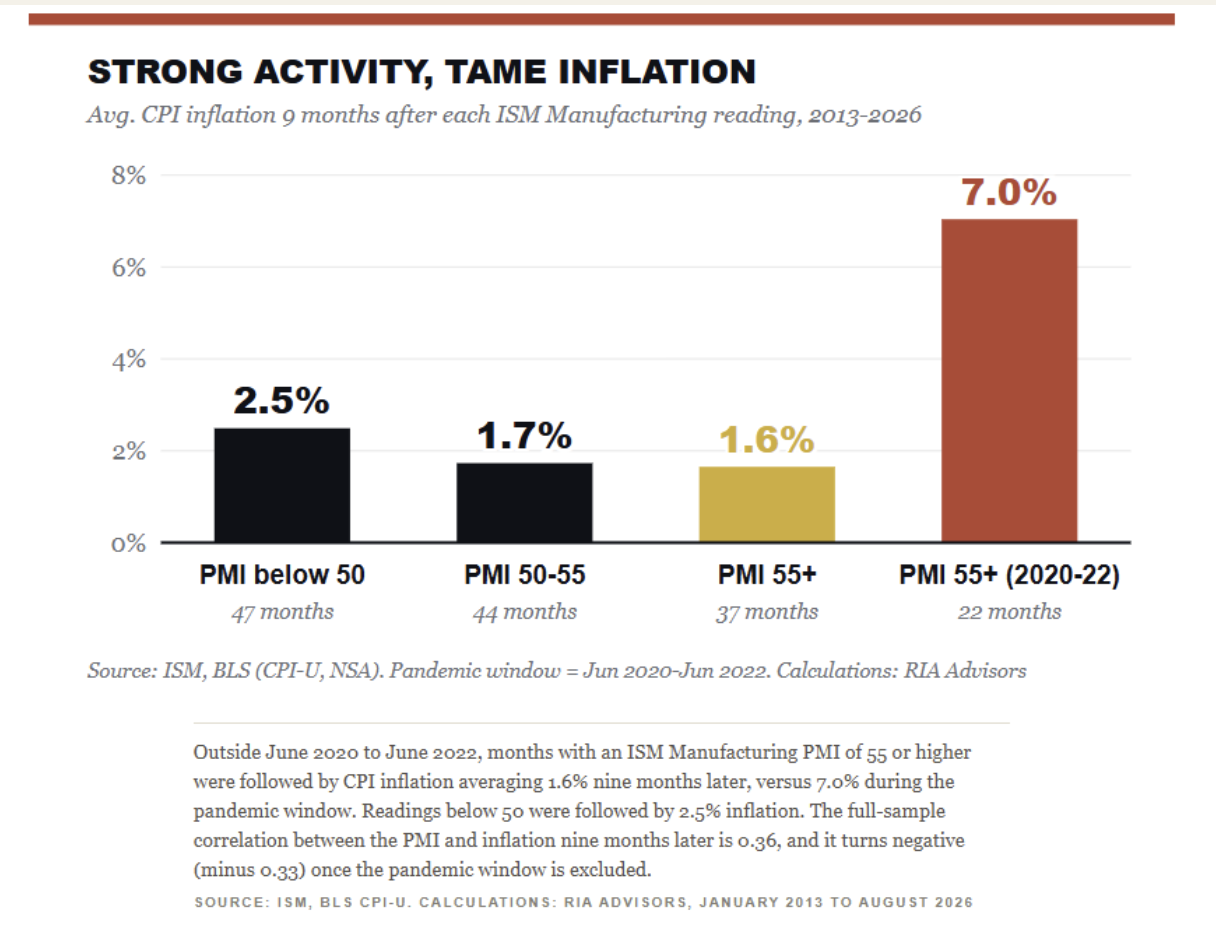
So, I tested it just to make sure. When you line up every monthly ISM Manufacturing reading since 2013 against CPI inflation nine months later, the relationship turns out to be far weaker than the “hot economy equals hot inflation” narrative assumes. Outside the pandemic window, the 37 months with a PMI of 55 or higher were followed by inflation averaging 1.6%. The only time strong activity preceded high inflation was mid-2020 through mid-2022, when stimulus checks collided with broken supply chains. Such is the problem with using 2021 as the template.
Here’s where the data gets interesting. Activity correlates with the change in inflation at about 0.55. In other words, a strong economy nudges prices higher. It doesn’t set the level. That’s the “good inflation” component, and it’s REAL today. ISM respondents have listed GPUs and memory in short supply as AI spending strains capacity.4
The bigger driver, however, is the “bad” kind of inflation. Headline CPI jumped to 3.7% in September, while energy prices ran 20.4% above a year ago.5 Services firms are paying more for diesel and gasoline. That’s why the services prices index hit 74.0 in September, its highest since mid-2022. Good inflation in capex, bad squeeze on the consumer. The Fed’s hike does little to the first and a great deal to the second.
See more: What’s Expired in Your Client’s Financial Pantry?
Earnings Are Running Ahead Of The Economy
That brings us to earnings. Topdown Charts’ S&P 500 earnings revisions pulse has surged to one of its highest readings since 2003. The average of the ISM manufacturing and services indexes, by contrast, sits only modestly above its norm.6 Historically, those two lines move together. When they split, they close the gap, either because the economy catches up or because revisions roll over.
“Rising earnings support rising asset prices, so why worry?”
If this were a historically normal economic cycle, that objection would carry the day. However, in today’s market, the issue is breadth. Earnings revisions are concentrated almost entirely in AI and capital spending sectors, where cash-rich hyperscalers barely notice a quarter-point rate hike. The newer, debt-funded cloud providers are another story, and October’s AI selloff showed how quickly that end of the trade can wobble. Notably, the FOMC itself described the backdrop this way:
“Productivity growth is strong, and capital investment is robust.”- FOMC statement, September 16, 2026
While that is true, it’s also the problem. Currently, the Fed is tightening an economy whose strongest engine doesn’t need credit. However, the parts of the economy that do need credit are already straining from higher rates. At the same time, that 5.1% risk-free rate raises the bar every that equity multiple has to clear. So, earnings can rise even while valuations compress. We saw exactly that in 2022, when S&P 500 earnings held up through the year while the index fell roughly 19% as the 10-year yield climbed from about 1.5% to near 4%.
The Consumer Is Spending Its Portfolio
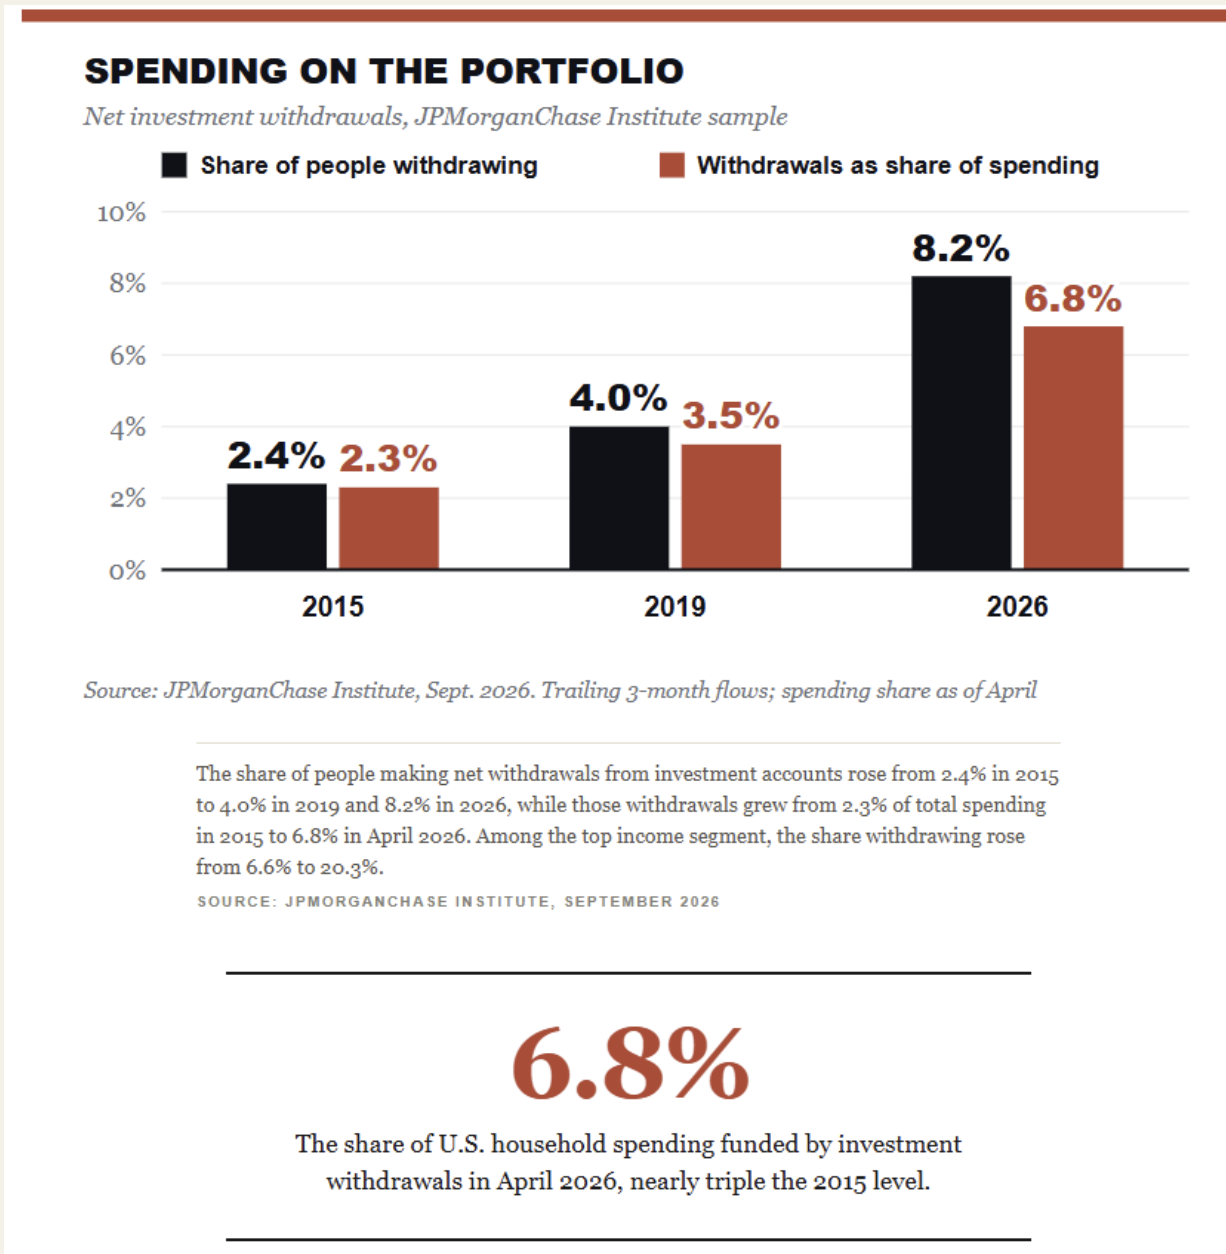
Point three is where I think the real risk of Fed over-tightening sits. For 15 years, rising markets quietly substituted for income growth. The JPMorganChase Institute, drawing on checking account data from more than 20 million Chase customers, now quantifies it.7 Net transfers from investment accounts into checking funded 2.3% of total spending in 2015. By April 2019, it was 3.5%. By April 2026, it was 6.8%, meaning that for every dollar American households spent this spring, nearly 7 cents came from selling stocks, bonds, and funds rather than from a paycheck.
Among top earners, withdrawals have funded more than 10% of spending every month this year. Notice the interruptions. The trend dipped in early 2020, through most of 2022 and in early 2025, each time stocks fell. Then add a personal saving rate of 4.1% in August, the lowest since late 2022 after BEA’s annual revisions, a backdrop we covered in our look at consumer credit stress. The top 10% of earners drive roughly half of all spending, according to Moody’s. It funds a growing slice of that spending by selling assets. And the bottom half has almost no savings cushion.
Some of this is demographic, and I’d be careful labeling all of it “stress.” Boomers drawing down retirement accounts is the decumulation I’ve written about before. Much of it is planned; however, the channel is the same regardless of motive. Higher rates pressure asset prices, lower asset prices shrink withdrawals, and smaller withdrawals shrink spending. The next recession probably doesn’t start with layoffs. It starts with a market decline that switches off the spending of the households that do most of it.
How Much Runway Does The Fed Have Before Fed Over-Tightening Bites?
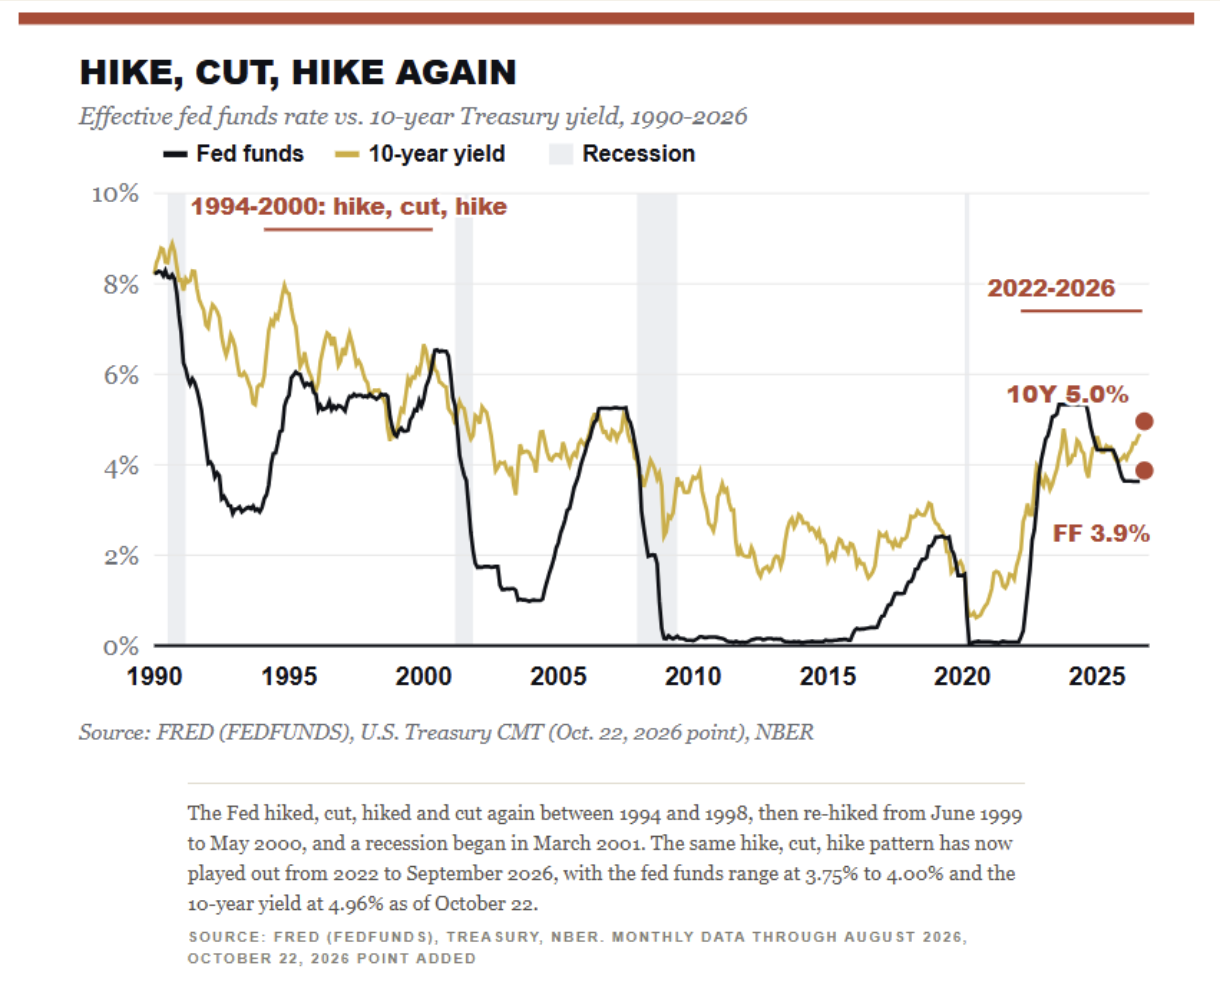
Which brings us to history. After the 1991 recession, the Fed hiked aggressively in 1994 and cut in 1995 and 1996. It hiked once in 1997, then cut again in 1998 during the LTCM crisis. It then re-hiked 175 basis points between June 1999 and May 2000. The recession began in March 2001, 21 months after that re-hike started and just 10 months after the final increase. Today’s sequence has the same shape: hikes in 2022 and 2023, cuts in 2024 and 2025, and a re-hike in September.
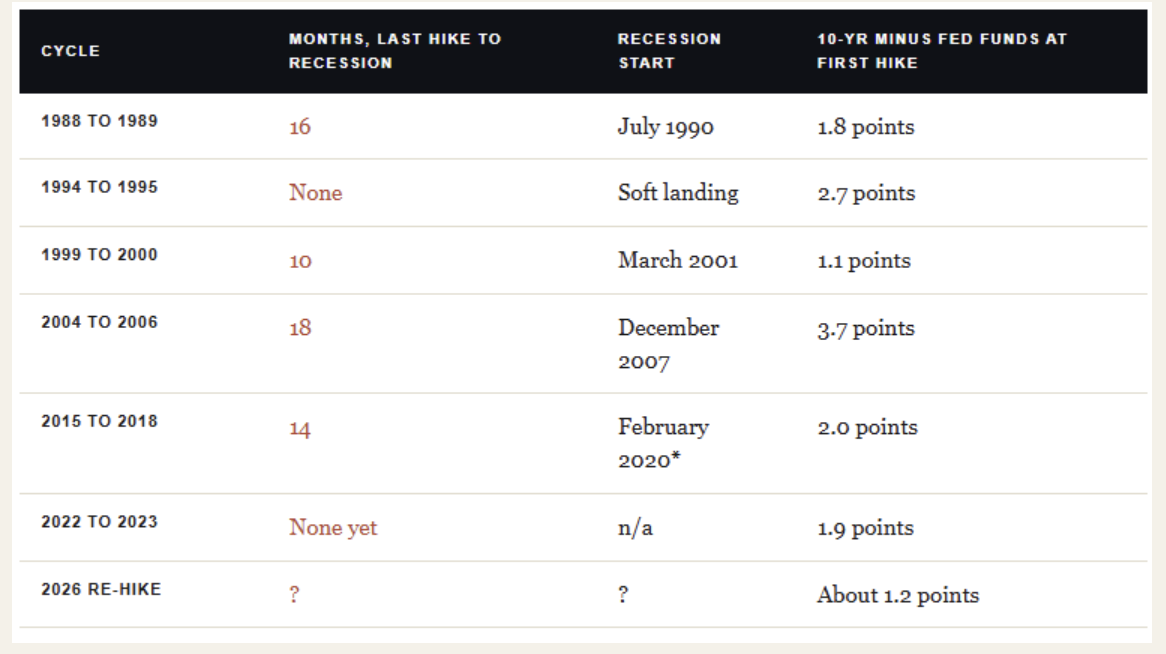
The table below lines up every tightening cycle since the late 1980s. Watch the last column. It shows how much tightening the bond market had already done when the Fed began hiking.
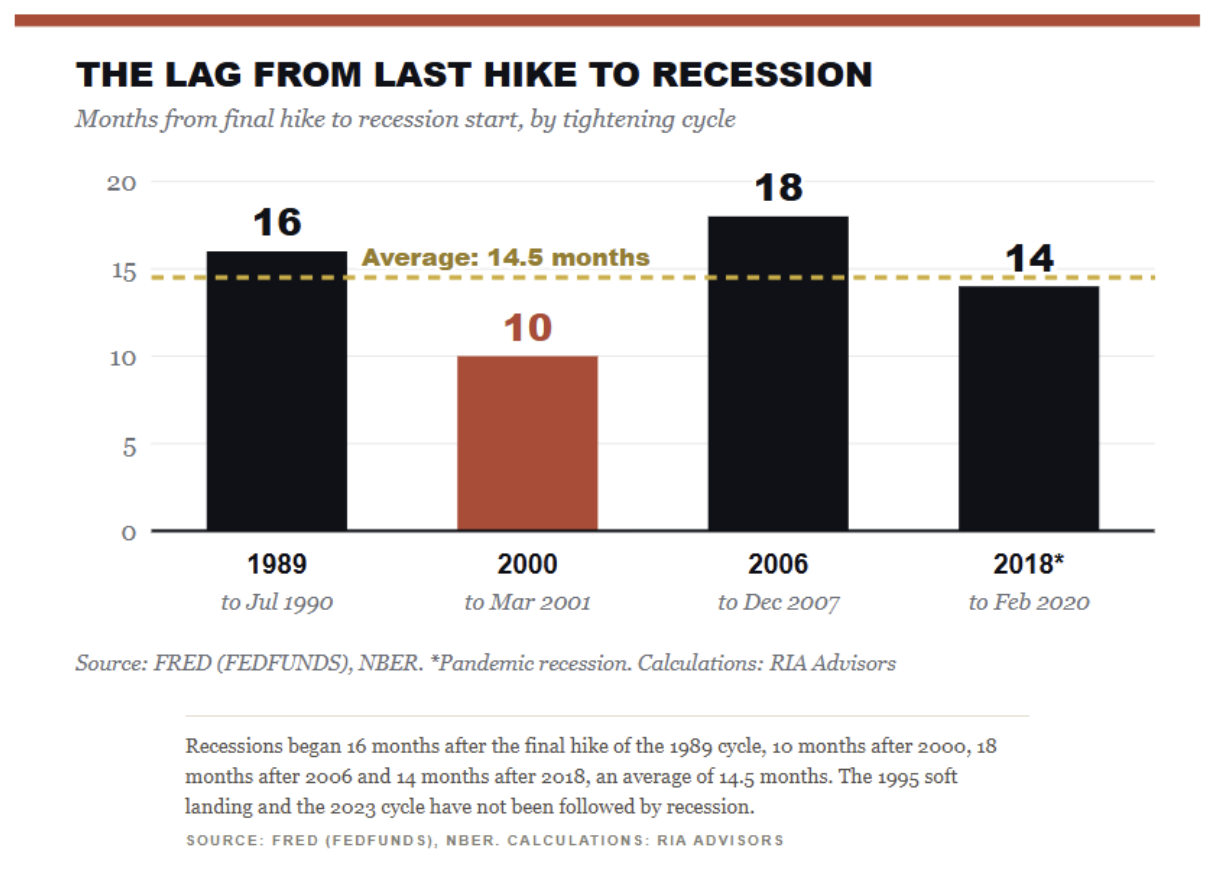
The closest match to today’s starting spread is 1999, the one cycle that took the least time to break something. Since 1989, the average lag from the final hike to a recession has been about 14 months, with a range of 10 to 18 months.8
This brings us to the entire question of this article: how much runway is left?
If the Fed delivers the rate hikes that the market currently expects, and history holds, it would be reasonable to expect economic troubles between late 2027 and mid-2028. However, I don’t trust that arithmetic this time.
With the 10-year already near 5%, mortgage and corporate borrowing costs reflect a far tighter stance than a 3.875% funds rate would imply, and the Fed’s own estimate of neutral is near 3.1%. Add a consumer whose spending rides on the stock market, and transmission runs through prices that reset daily. I’m reasonably confident the lag will be shorter than the historical average. I’m far less confident about the exact month, and anyone claiming precision here is guessing.
“The Fed doesn’t need to hike until something breaks. The bond market and a consumer living off its portfolio have already shortened the fuse.”
Where The Bulls Are Right
The bulls have a real case. The 1995 cycle ended in a “soft landing” even after the Fed doubled the funds rate in a single year, and the Fed’s own projections see unemployment at just 4.1% with solid growth. Productivity is strong, AI investment is running hot, and earnings keep beating. The Daily Shot’s long-history chart makes a fair point, too. A 5% 10-year yield is roughly the average since 1800 and well below the average since 1960. By that measure, rates are simply “normal” again, which is a view I share.
A question that I have been repeatedly asked of late is: “If rates are normal, why would normal rates cause a recession?”
Because “normal” is relative to the debt and the dependencies built during the abnormal years. Normal rates on a far larger debt stock, and on households that sell assets to spend, don’t produce a normal outcome. Such is the cost of 15 years of zero rates and QE. As we often state, when everyone thinks one thing will happen, something else usually does. Currently, the consensus sees little downside risk.
What Fed Over-Tightening Risk Means For Investors
Howard Marks has long made the point that you can’t predict, but you can prepare. That applies here more than usual. The risk of Fed over-tightening doesn’t argue for dumping equities, but it does argue for recognizing that the asset-price channel now matters more to the economy than at any point in the last cycle. A 10% to 15% decline would hit the economy harder than in 2018. It would directly cut spending by the top income cohort.
In portfolio management terms, that means taking some actions today to protect against negative outcomes in the future.
- Rebalance winners to their target weights rather than chasing them.
- Keep exposure to rate-sensitive, consumer-dependent businesses measured.
- It also means respecting what a 5% Treasury yield offers patient investors.
As my colleague Michael Lebowitz laid out in Whether the bond market has already done the Fed’s job, long rates hit housing, refinancing, and valuations with a lag, so much of that damage hasn’t arrived yet. The watch list is short. Track the 10-year above 5%, the ISM employment indexes, the JPMorgan withdrawal data, and the saving rate. When the withdrawal channel slows while the Fed is still hiking, that’s your signal.
Bottom line: The bond market and an asset-dependent consumer have already done much of the Fed’s work, so each additional hike raises the risk of Fed over-tightening far faster than the historical lag suggests.
The Fed is hiking to prove it can beat inflation. The danger is that it proves the point with the one economy that can’t afford to lose.
Questions This Article Answers
What is Fed over-tightening? Fed over-tightening happens when the Federal Reserve raises rates beyond what the economy can absorb, slowing demand enough to trigger a recession and, eventually, disinflation. The risk rises when long-term yields have already tightened financial conditions, as the 10-year Treasury near 5% has done in 2026.
Does a strong ISM reading mean inflation will rise? Not reliably. Outside the 2020 to 2022 period, months with an ISM Manufacturing PMI of 55 or higher were followed by CPI inflation averaging about 1.6% nine months later. Strong activity tends to push inflation higher, but supply shocks and stimulus have driven the big moves.
How long after the last Fed rate hike does a recession usually start? Since 1989, recessions have started an average of about 14 months after the final hike of a tightening cycle, with a range of 10 to 18 months. The 1995 cycle ended in a soft landing, so a recession isn’t guaranteed.
Why do investment withdrawals matter for the economy? JPMorgan Chase Institute data show that withdrawals from investment accounts funded 6.8% of household spending in April 2026, up from 2.3% in 2015. That makes consumer spending more sensitive to stock market declines, so higher rates that pressure asset prices can slow the economy faster than in past cycles.
Sources & Notes
- Federal Reserve. FOMC statement and implementation note, September 16, 2026.
- Advisor Perspectives and CNBC. September 2026 dot plot coverage, September 16, 2026. CME FedWatch and Kalshi pricing for the October 28 and December 9 meetings, as of October 23, 2026.
- Institute for Supply Management. September 2026 Services PMI Report (October 5) and September 2026 Manufacturing PMI Report (October 1). The 80/20 composite is an RIA Advisors calculation.
-
Institute for Supply Management. “ISM PMI Reports Roundup: August Services,” September 2026.
-
U.S. Bureau of Labor Statistics. Consumer Price Index, September 2026, released October 14, 2026. BEA, Personal Income and Outlays, August 2026, released September 30, 2026, including annual revisions..
-
Topdown Charts and LSEG. “Earnings Revisions vs PMIs,” via ISABELNET. Chart reproduced in description only because the revisions pulse is a proprietary series.
- JPMorganChase Institute. “More U.S. households are supporting spending by drawing on investment wealth,” Wheat, Eckerd, and O’Brien, September 2026.
- Federal Reserve H.15 via FRED (FEDFUNDS) and the NBER business cycle chronology. Lag and spread calculations by RIA Advisors using monthly averages. 10-year yields from the Treasury constant-maturity series (monthly, via the datasets/bond-yields-us-10y archive), with the October 22, 2026 level from the Treasury par yield curve.
- The Daily Shot. “US Treasury Yield” long-run averages chart, 2026.
- Replication note. The ISM-to-inflation analysis uses the ISM Manufacturing PMI (January 2013 to August 2026) against the BLS CPI-U, unadjusted for seasonality. Correlations: 0.36 at a nine-month lead for the full sample, minus 0.33 excluding June 2020 to June 2022, and 0.55 against the 12-month change in inflation.
Lance Roberts is a Chief Portfolio Strategist/Economist for RIA Advisors. He is also the host of “The Lance Roberts Podcast” and Chief Editor of the “Real Investment Advice” website and author of “Real Investment Daily” blog and “Real Investment Report“. Follow Lance on Facebook, Twitter, Linked-In and YouTube Customer Relationship Summary (Form CRS)
Join RIA Advisors and elevate your career within a deeply experienced team focused on innovation. Our collaborative environment is built on a foundation of advanced technology and effective investment models, designed to enhance your ability to serve clients and grow your practice. Benefit from a supportive culture that encourages professional development and fosters a forward-thinking approach. By joining our team, you’ll be part of a group dedicated to excellence and continuous improvement, empowering you to focus on building meaningful client relationships and pursuing your business ambitions. Discover the advantages of working with our accomplished advisory team by starting your conversation today.
A message from Advisor Perspectives and VettaFi: Discover something new! Click here to register for our upcoming webcasts.
© Real Investment Advice
Read more commentaries by Real Investment Advice