Income Does the Heavy Lifting
Membership required
Membership is now required to use this feature. To learn more:
View Membership Benefits
There are plenty of reasons to love long weekends. Rest, travel, time with family. But at today's yields, there's one more: your portfolio keeps working while you're away. As a simple illustration, at a 7% annual yield, a $1 million portfolio generates roughly $575 over a single three-day weekend.1 Markets close, prices stop moving on screens, but interest can continue accruing.
For years, investors had to stretch for returns, venture further out on the risk spectrum, absorb more volatility, and extend duration just to generate meaningful income. But with yields across high-quality fixed income at levels we haven't seen in a generation, the question has fundamentally changed. It's no longer how much risk can we take. It's how much risk do we actually need to take?
Fixed income: Getting paid to take less risk
The power of starting yield is difficult to overstate. Take another illustration, $10 million invested in U.S. investment grade credit generates approximately $30,300 of carry across 21 calendar days (seven long weekends), 2.7 times the 2021 level.2 All without needing to reach into obscure corners of the market, it's simply what high-quality fixed income pays today.
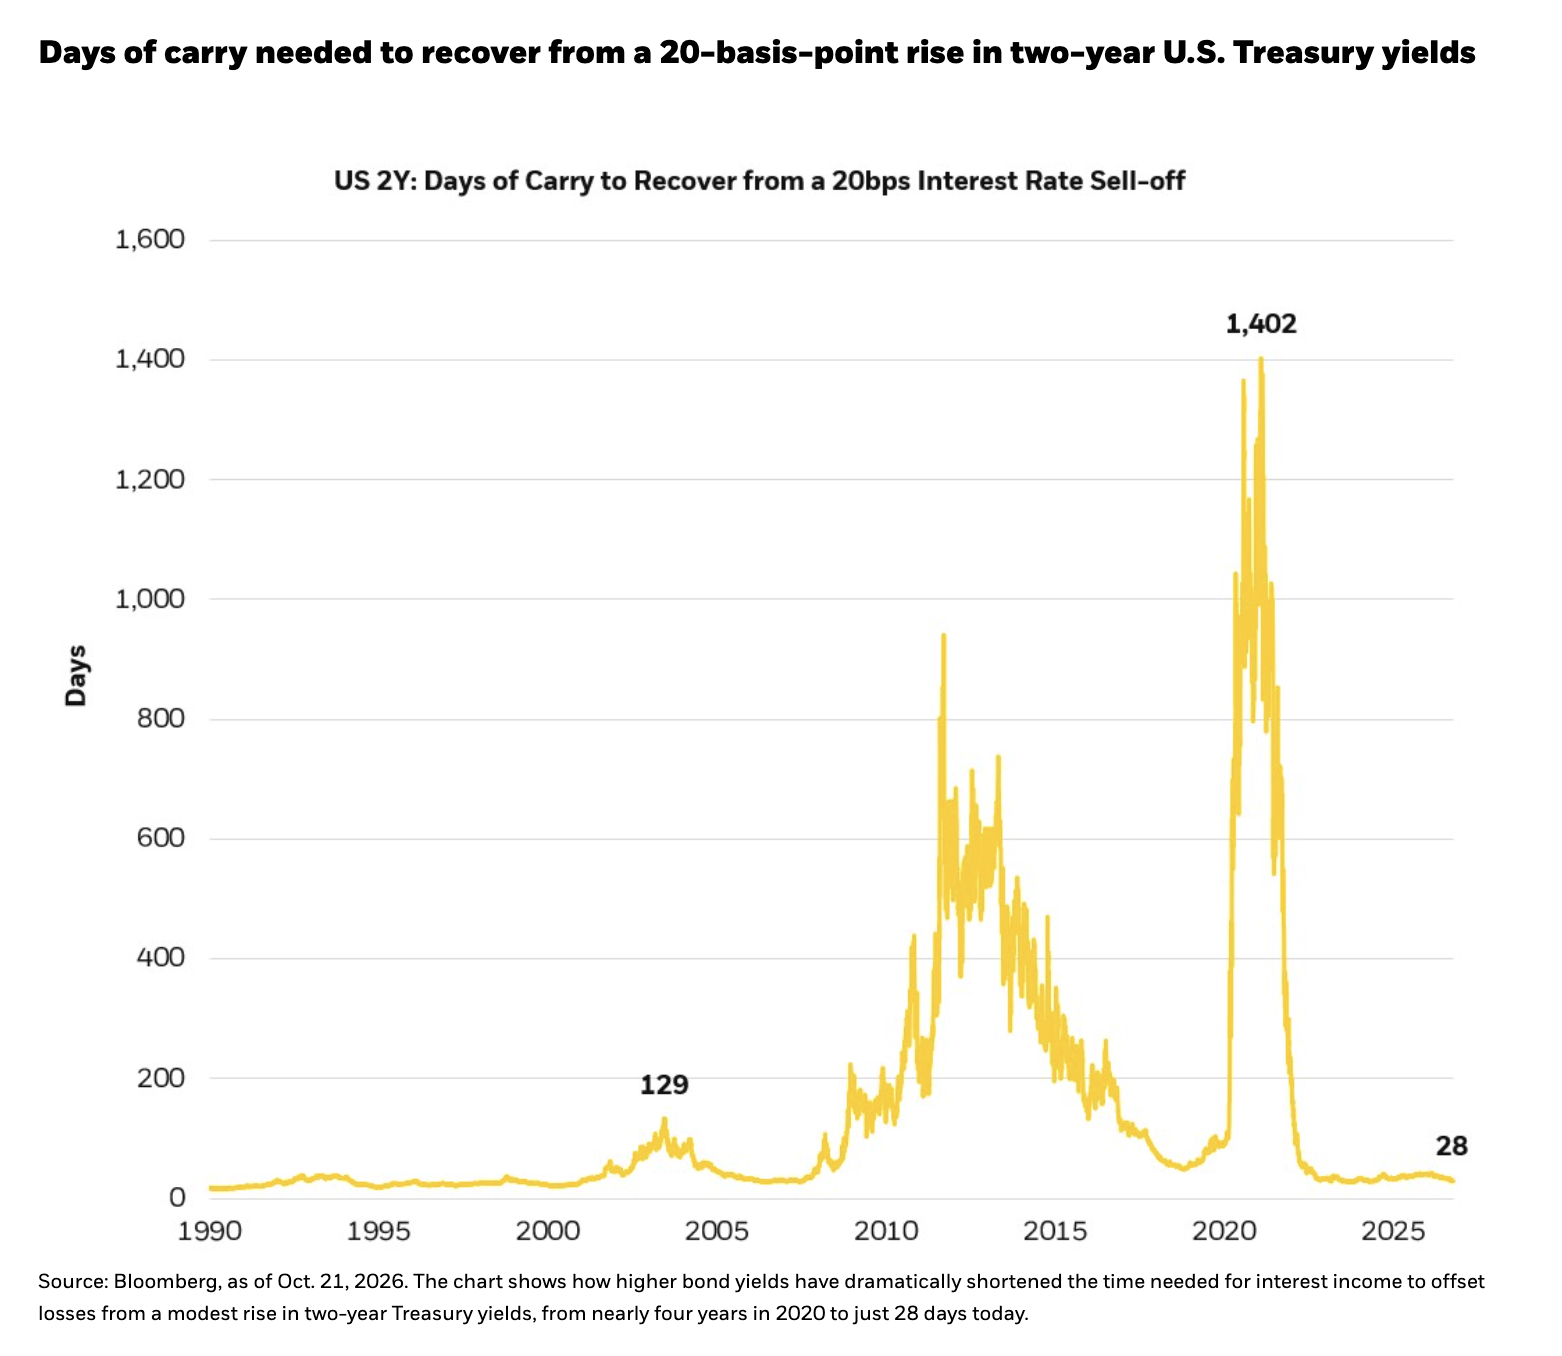
Beyond generating income, today's starting yields have fundamentally changed the recovery math. In the early 2020s, it would have taken nearly four years of income to offset a modest rise in two-year Treasury yields. Today, higher starting yields mean that same loss could be recovered in just 28 days.3 The cushion is substantial across fixed income: Take another illustration which shows yields would need to rise 147 basis points on the U.S. 5-year, 91 basis points on investment grade and 232 basis points on high yield before a full year of carry is erased.4 Higher yields may provide more information to help offset potential price declines if interest rates rise.
Across the global markets, real yields look as compelling as they have in more than a decade. The U.S. 10-year real rate sits at its 100th percentile since 2010.5 Australia, the U.K., and Germany are all near or above their 90th percentile.6 For years, investors were penalized for holding safe assets. That penalty has been inverted. Today, investors may get paid handsomely for sitting in real rates.
See more: Why the AI Story May Be Stronger Than Skeptics Think
Growth is strong, but the engine is narrow
Make no mistake: the U.S. economy continues to perform. Implied nominal yields based on historical growth and rate ratios suggest the current yield curve is fairly pricing a regime of solid real growth alongside persistent inflation.
But the composition of that growth matters, and it has become strikingly narrow. Virtually all the strength is concentrated in rate-insensitive nonresidential investment, primarily AI and infrastructure-related capex. Residential investment contracted at an annualized rate of 4.9% over the past two quarters.7 Goods consumption is barely positive.8 The growth engine is running on one extraordinarily powerful cylinder, but it's still just one cylinder.
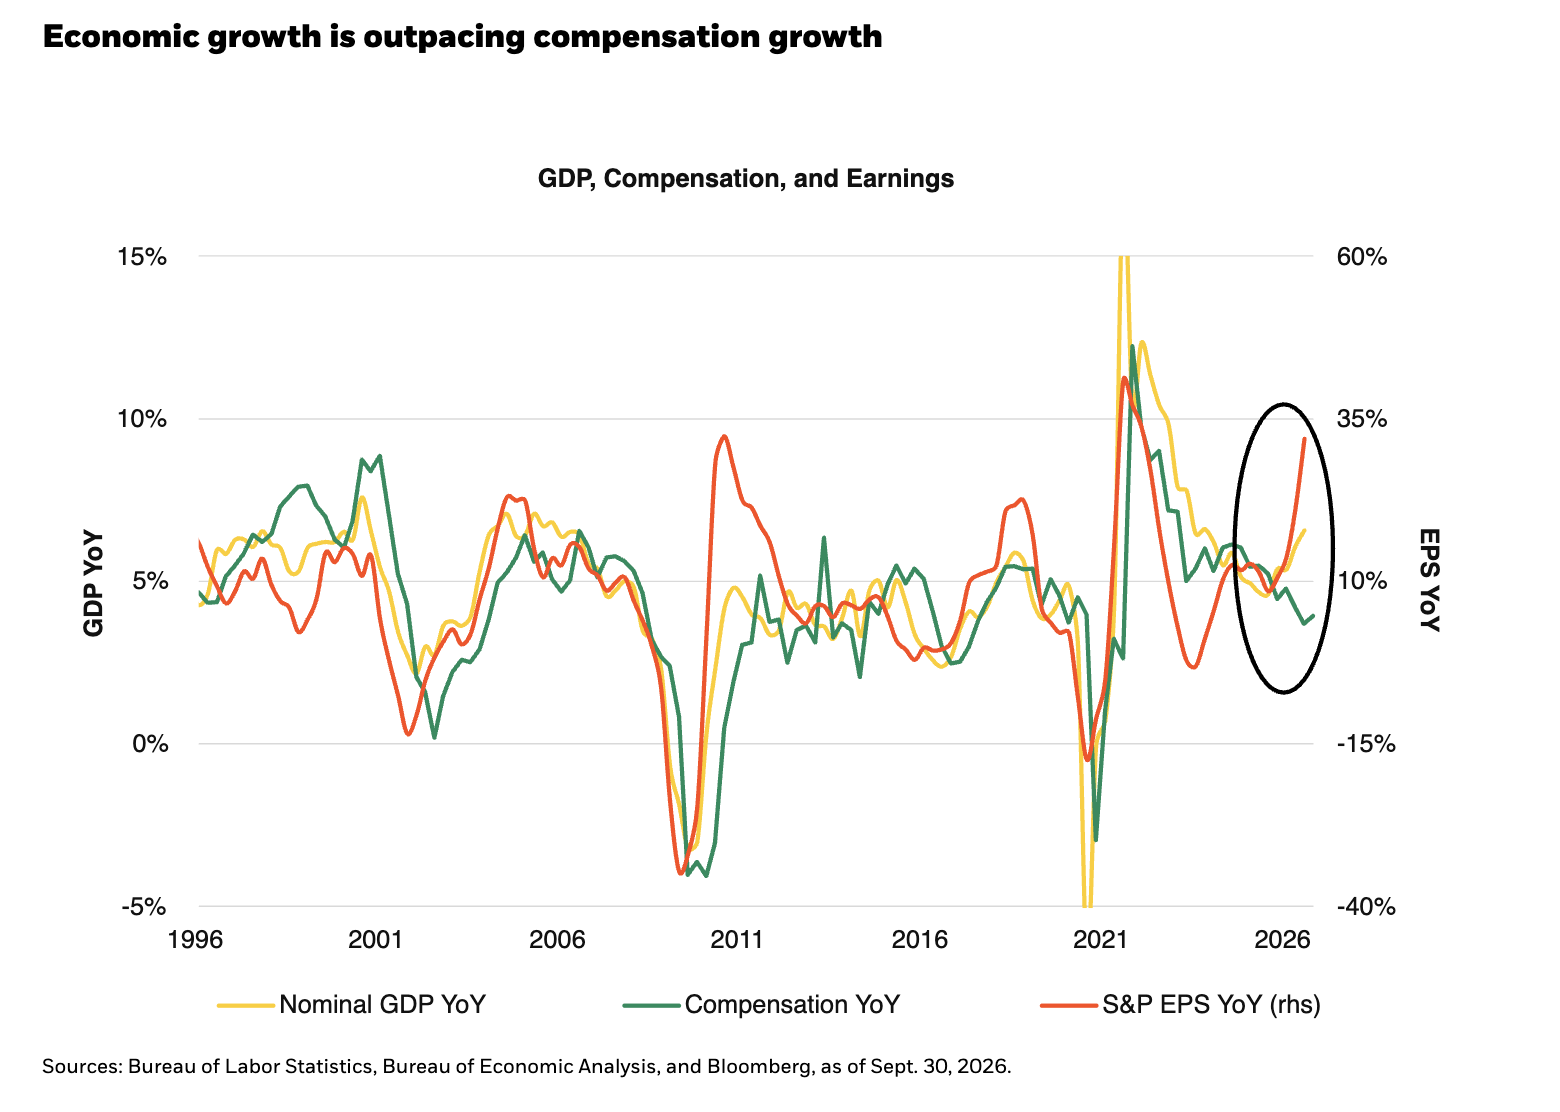
Meanwhile, the relationship between growth and labor continues to decouple in a staggeringly clear way. Third-quarter nominal GDP is tracking near 7% year-over-year while compensation growth has stalled at around 5%. Profit per employee has surged back to 20%+ growth.9 The labor market is stable but unimpressive, and growth may increasingly come at the expense of labor, not alongside it.
Inflation, too, remains stickier than many expected. Core consumer price index (CPI) inflation on a 3-month annualized basis has ticked back up, and even shelter inflation is showing renewed firmness. The Fed faces a difficult policy trade-off, with the federal funds rate at 3.75% to 4.00%. The challenge is that the Fed is essentially operating a house with one thermostat but very different temperatures in every room. Cyclical, rate-sensitive components of inflation appear relatively well controlled, but the hot spots, including energy, insurance, healthcare, education and shelter, are areas where another 25-basis point increase in the federal funds rate is unlikely to have much effect. In fact, a good deal of the shelter pressure exists precisely because mortgage rates are too high to build homes and unfreeze the housing market. Turning the thermostat down further may make the rooms that are already cool even colder, without doing much to cool the ones that remain hot. Hawkish rhetoric and patient policy can coexist, and we think they should.
The AI investment cycle: massive, magnificent, and increasingly concentrated
Hyperscaler capital expenditure (capex) is expected to reach $1 trillion in 2026 and $1.7 trillion in 2027, with upside risk.10 Financing this expansion increasingly requires significant issuance across debt and equity markets.11 The scale of that issuance is immense: total AI-related capital raising is projected at roughly $1.1 trillion in 2026 and $1.3 trillion in 2027.12 AI-related debt outstanding is expected to be larger than the entire U.S. high yield market by the end of 2027.13 This surge in AI financing is reshaping fixed income supply dynamics in real time.
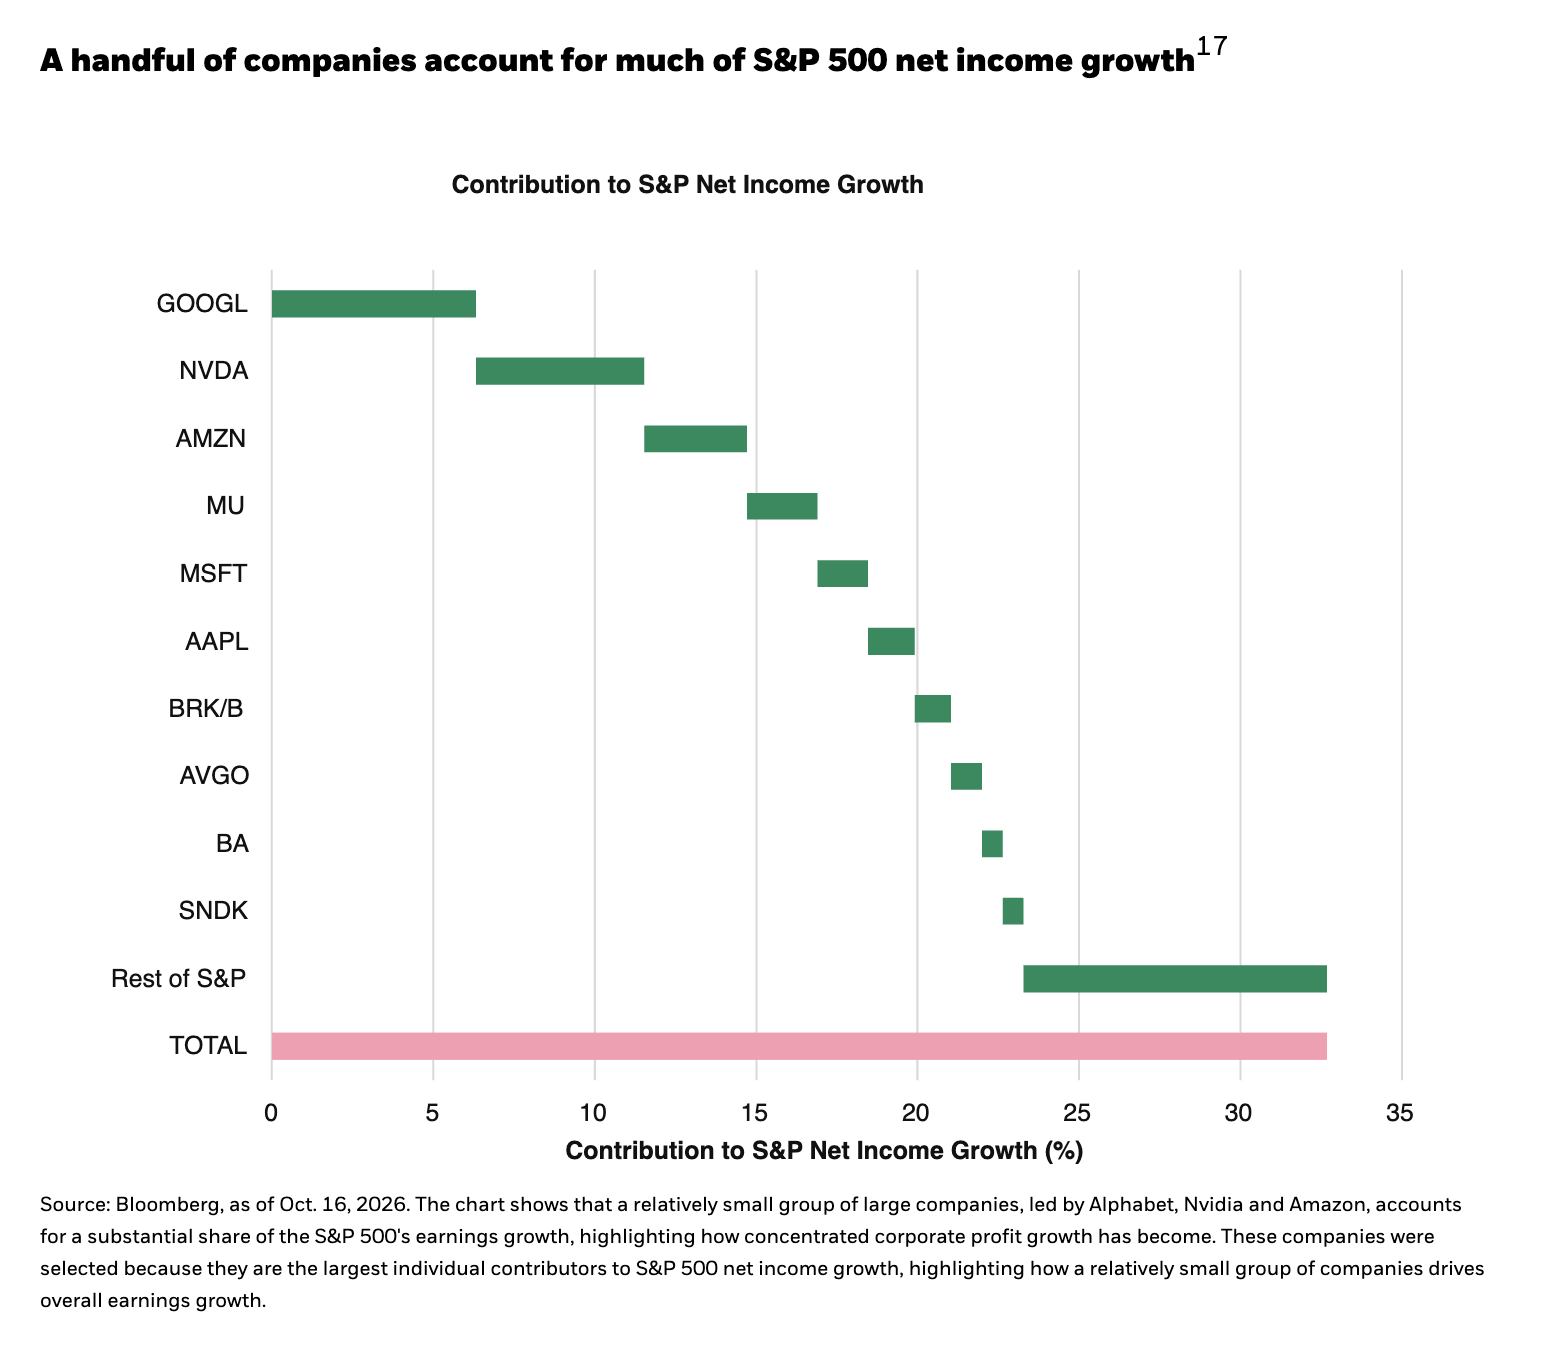
Just 10 companies now account for 40% of S&P 500 market capitalization and over 40% of its net income. Twenty stocks account for approximately 92% of the year-to-date increase in index EPS estimates (92%!). Expected EPS growth for the S&P 500 is 27%, but strip out the top 10 and it drops to 11%. Remove the largest 200 and you're at 5%.14
Concentration isn't just a valuation concern; it's a structural sensitivity. Using a hypothetical illustration, 50% moderation in the top companies' earnings growth rate would bring S&P 500 net income growth from roughly 32% down to around 20%,15 a significant swing driven by a handful of names all exposed to the same theme.16 High AI growth expectations and continued capital investment leave increasingly little room for any change in trajectory or disappointment, particularly given all the debt, equity, and rollover financing required from here.
The key question going forward is which companies can turn strong demand into lasting profits that justify the cost of their investments, and whether investors are better positioned in their stocks, bonds or both. So far, the largest increases in AI debt financing have come from companies with low leverage and high return on invested capital (ROIC). But as financing costs rise, the margin for error narrows.
The case for rebalancing: it's in the data
The equity risk premium sits at its 7th percentile over the last three decades, meaning investors are getting paid very little incremental compensation for taking equity risk over fixed income. U.S. household equity allocations are at a record 71% of liquid assets while fixed income sits at just 8%, the lowest level in more than 40 years. Each percentage point of that liquid pool represents approximately $1.1 trillion.18
History is unambiguous here. Across U.S. and European credit, subsequent five-year annualized returns have historically tracked starting yields remarkably closely. Today's combination of strong economic growth alongside high available yields has historically tended to be one of the most favorable setups for forward fixed income returns.19
The recent equity rotation underscores this. Many AI names have unwound sharply since June while defensive sectors outperformed. When stocks start at higher valuations, returns can vary widely, even when corporate earnings are growing strongly. Historically, when S&P 500 earnings have grown by more than 10% and stocks were trading at more than 20 times earnings, market returns have ranged from losses of roughly 30% to gains of 50%.20 But that cuts both ways. High multiples certainly don't mean equities can't deliver very attractive returns, particularly with growth still solid and productivity gains helping margins. In fact, we think the next 12 months could be quite good for equities. We just expect a bumpier ride, with a much wider range of winners and losers along the way.
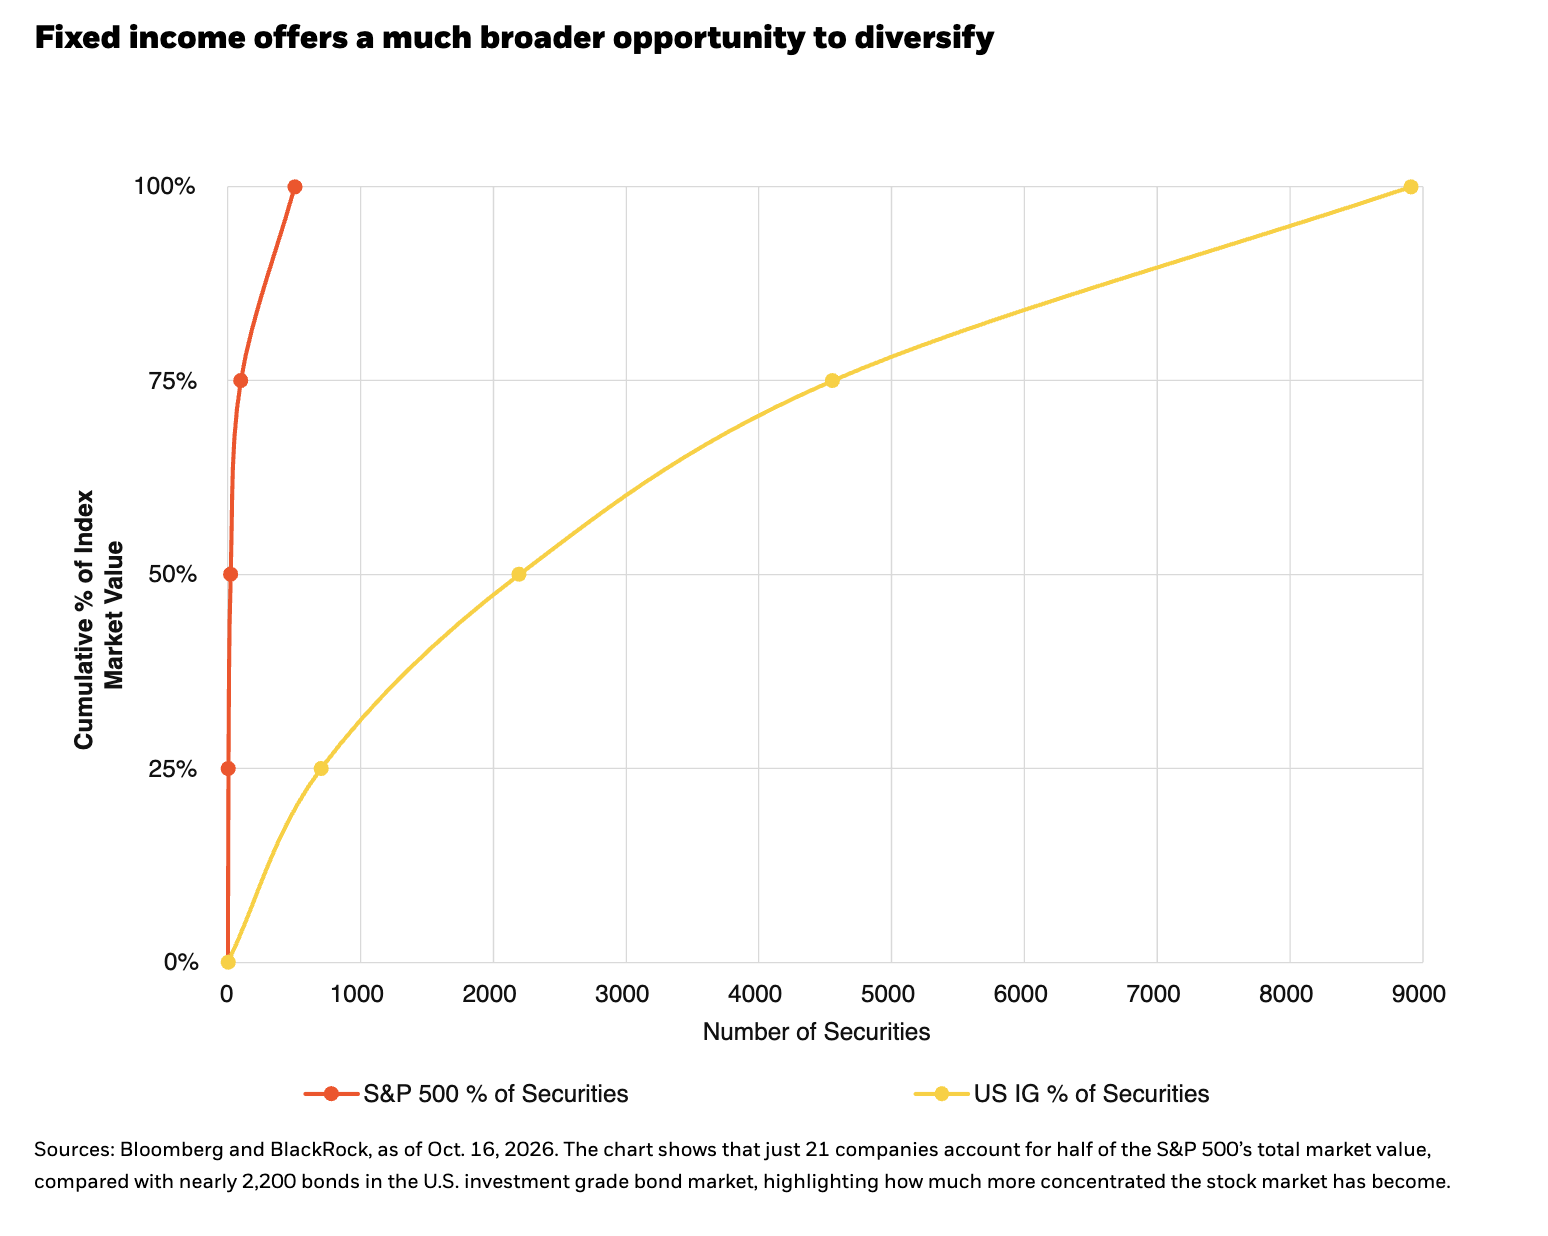
Meanwhile, fixed income offers a very different proposition today. With starting yields across the spectrum materially higher than in the prior decade, we believe there may still be an opportunity for investors to generate income without depending on price appreciation to drive returns. And the breadth of the market provides an opportunity to diversify that income across issuers, sectors and structures, while maintaining a focus on credit quality. In our view, the combination of higher starting yields and the potential diversification benefits of bonds makes fixed income a consideration in portfolio construction.
The other side of selectivity: Credit quality matters more here
Headline spreads in high yield mask notable dispersion. A record share of bonds in the index now offer relatively little additional yield to compensate investors for credit risk, while the gap in yields between lower-rated B bonds and riskier CCC bonds is approaching levels seen during past financial crises. In this environment, we believe investors should be cautious about taking on significant exposure to riskier debt.
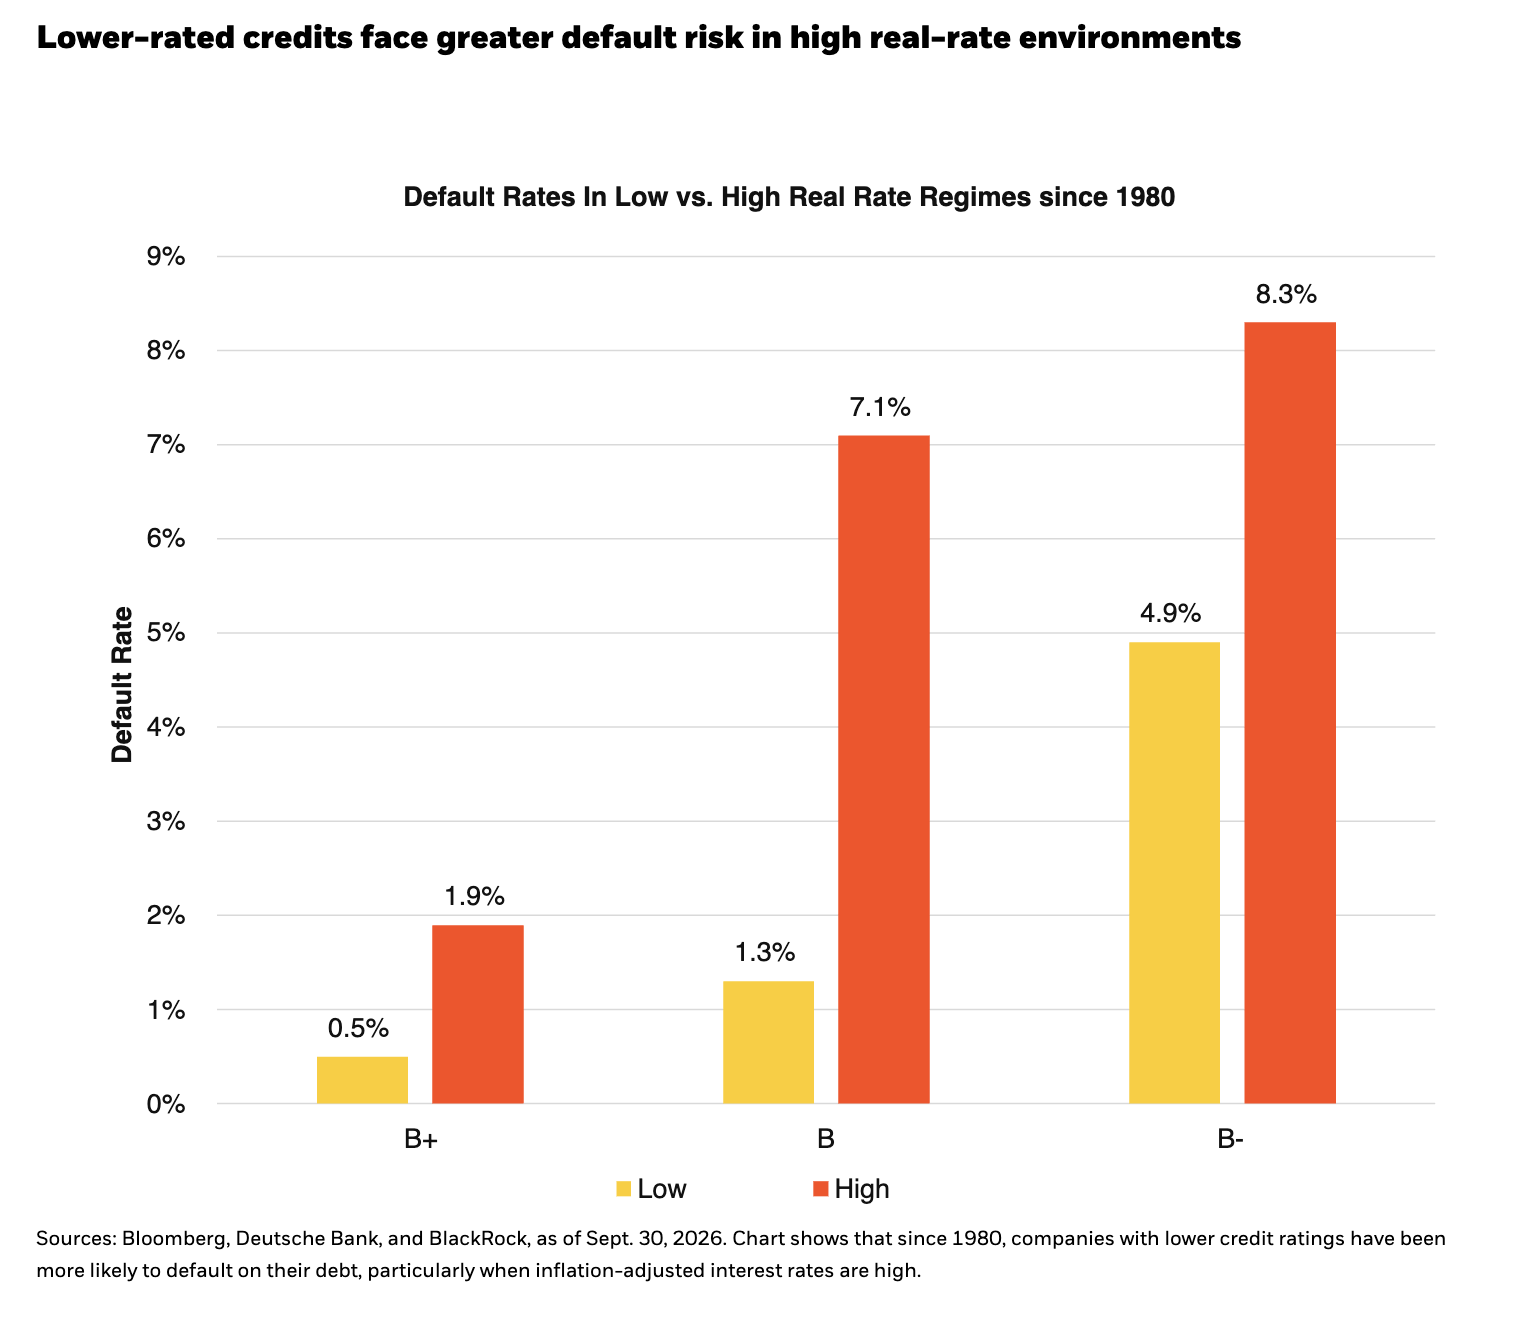
The risk of refinancing existing debt at higher interest rates is significant. Companies with B credit ratings that need to refinance in 2027 could face substantially higher borrowing costs, while those rated CCC face even greater challenges. Historically, companies with B-minus ratings have defaulted at an annual rate of roughly 8.3% when inflation-adjusted interest rates are high, compared with 4.9% when rates are low.21
At the same time, while security selection can’t assure positive results, we believe there's no shortage of idiosyncratic opportunity in asset-backed securities (ABS), commercial mortgage-backed securities (CMBS) and emerging market (EM) local markets for investors willing to do the work on security selection. But a long weekend is only relaxing when your portfolio is built to withstand the unexpected. We believe the opportunity is to source income from quality and breadth, not to stretch for an extra 50 basis points.
Bottom line: Let your portfolio work so you don't have to
By way of illustration, if you are able to generate a 7% annual yield, a $1 million portfolio earns approximately $575 every three-day weekend. That covers roughly half the cost of an average three-day trip from New York, generated almost entirely from high-quality assets.22
The regime has shifted. Fixed income yields are at historically attractive levels. Real rates are positive across the globe. The equity risk premium is paper-thin, and equity market concentration creates fragility that investors don't need to accept. We believe today's starting yields give investors a much greater opportunity to generate meaningful income and diversify portfolios without relying exclusively on equity appreciation.
We believe this is a moment for investors to consider:
- Anchor portfolios in high-quality, short-to-intermediate duration income.
- Being patient about adding interest rate risk, particularly beyond five years, where the extra yield doesn't compensate for the incremental loss potential.23
- Use fixed income's breadth as a structural advantage (just 21 stocks account for half the S&P 500's value; while more than 2,000 bonds account for half of the investment-grade index).
- Be selective in lower-quality credit, where spreads mask a meaningful repricing of rollover and default risk.
- Stay constructive on equities, with solid growth and productivity supporting another potentially good year, but be prepared for greater volatility and dispersion.
The markets will close again this Friday. The screens will go quiet, but interest can keep accruing. Enjoy the weekend.
Rick Rieder, Chief Investment Officer of Global Fixed Income and Head of the Global Allocation Investment Team
Footnotes
1. Illustrative: $1m x 7% annual yield x 3/365 = $575.34, rounded. Excludes fees, reinvestment and price changes. BlackRock calculation, Oct. 2026.
2. Bloomberg, Oct. 14, 2026. Carry = $10m x U.S. IG index annual carry on yield x 21/365; the 2.7x comparison uses corresponding 2021 and 2026 index carry. Index is Bloomberg US Corporate Credit Index. Yield basis is yield-to-worst. 2021 comparison uses the same source and methodology. Carry is calculated as the starting yield plus the estimated price return from one year of roll-down along the current yield curve, assuming the yield curve remains unchanged.
3. Bloomberg as of Oct. 31, 2026, breakeven defined as days of carry (yield and curve roll down) to offset price impact from a 25 basis point rise in yields.
4. Bloomberg, Oct. 14, 2026. Approximate recovery days = duration-based loss from a 20-bp yield rise / daily carry. One-year carry cushion is the yield rise needed to offset one year of carry. Carry is calculated as the starting yield plus the estimated price return from one year of roll-down along the current yield curve, assuming the yield curve remains unchanged. Illustrative, excluding convexity and spread changes.
5. Bloomberg as of Oct. 31, 2026. “100th percentile” meaning it is at the highest level recorded since 2010.
6. Bloomberg, Oct. 21, 2026. Percentile of 10-year government real yields since 2010: U.S. 100th; Australia 99th; U.K. 100th; Germany 97th.
7. Bureau of Economic Analysis, as of Sept. 30, 2026. Residential investment is defined as spending on new housing construction, home improvements and real estate transactions, including brokers’ commissions.
8. Bureau of Economic Analysis and Bloomberg, Aug. 31, 2026. Annualized change in real expenditure components over two quarters through Q2 2026; residential investment: -4.9%.
9. Bureau of Economic Analysis and Bloomberg, Aug. 31, 2026; Bureau of Labor Statistics and Bureau of Economic Analysis, June 30, 2026. Figures use compensation and nonfinancial profits-per-worker series.
10. Bloomberg and BlackRock, Oct. 16, 2026. Forecast U.S. hyperscaler capex for 2026-27; not actual results. Forecasts may not come to pass.
11. Bloomberg and BlackRock, Oct. 16, 2026. AI investment financing need reflected in free cash flow, projected debt and equity issuance.
12. Bloomberg and BlackRock, Oct. 16, 2026; Goldman Sachs, Sept. 21, 2026. AI-related issuance comprises IG/HY debt, loans, securitized finance, public/private equity and converts; 2026-27 figures are forecasts. Forecasts may not come to pass.
13. BlackRock Global Fixed Income, represents BlackRock forecasts, forecasts may not come to pass, as of Oct. 31,2026.
14. Bloomberg, Sept. 30, 2026 (market cap and net income) and Oct. 16, 2026 (EPS estimates). Figures represent broad S&P 500 index-level observations about market capitalization, earnings and concentration, figures do not represent performance. The 5% figure is for the smallest 300 S&P 500 companies, excluding the largest 200. Forecasts may not come to pass.
15. This does not represent an investable portfolio and is provided for illustrative purposes only.
16. Bloomberg, Sept. 30, 2026. Scenario analysis is hypothetical. Sensitivity applies +/-50% to Q2 2026 earnings growth rates of highlighted large companies, holding other companies constant, then recomputes aggregate S&P 500 net income growth.
17. Specific companies referenced are for informational purposes only and do not constitute a recommendation to buy, sell or hold any security.
18. Bloomberg, Oct. 14, 2026 (equity risk premium); Federal Reserve, June 30, 2026 (household allocations). 1 percentage point x $106.5tn in liquid household assets = ~$1.1tn.
19. Bloomberg, as of Oct. 31, 2026. The comparison uses starting yield-to-worst and subsequent five-year annualized returns for 1-to-5-year U.S. and euro investment grade corporate credit. Past relationships may not repeat.
20. Bloomberg, Oct. 16, 2026. Distribution of subsequent one-year S&P 500 returns since 1990 in periods with EPS growth above 10%, grouped by starting P/E; the cited range is for starting P/E above 20x.
21. Sources: Bloomberg, Deutsche Bank and BlackRock, Sept. 30, 2026. Observed annual default rates by rating in high- and low-real-rate regimes since 1980.
22. Source: BlackRock, represents average cost per person across 15 popular U.S. long-weekend destinations from New York, NY. $575 is a hypothetical mathematical illustration (7% yield × $1M × 3/365) that is not a return or income anyone can expect to receive.
23. Bonds with longer durations are generally more sensitive to changes in interest rates, and when rates rise, bond prices typically fall. This view reflects our current opinion, may change, and is not a guarantee of future results.
Investing involves risks, including possible loss of principal. Past performance is no guarantee of future results. Index performance is shown for illustrative purposes only. It is not possible to invest directly in an index.
Performance data quoted represents past performance and is no guarantee of future results. Investment returns and principal values may fluctuate so that an investor’s shares, when redeemed, may be worth more or less than their original cost. All returns assume reinvestment of dividends and capital gains. Current performance may be lower or higher than that shown. Refer to blackrock.com for most recent month-end performance.
Carefully consider the Funds' investment objectives, risk factors, and charges and expenses before investing. This and other information can be found in the Funds' prospectuses or, if available, the summary prospectuses which may be obtained by visiting www.iShares.com or www.blackrock.com. Read the prospectus carefully before investing.
Fixed income risks include interest-rate and credit risk. Typically, when interest rates rise, there is a corresponding decline in bond values. Credit risk refers to the possibility that the bond issuer will not be able to make principal and interest payments. International investing involves risks, including risks related to foreign currency, limited liquidity, less government regulation, and the possibility of substantial volatility due to adverse political, economic, or other developments. These risks may be heightened for investments in emerging markets.
Asset-backed securities are subject to credit, interest rate, call, extension, valuation and liquidity risk and are subject to the risk of default on the underlying asset or mortgage, particularly during periods of economic downturn. Small movements in interest rates may quickly and significantly reduce the value of certain ABS. Mortgage-backed securities ("MBS") and commercial mortgage-backed securities ("CMBS") are subject to prepayment and extension risk and therefore react differently to changes in interest rates than other bonds. Small movements in interest rates may quickly and significantly reduce the value of certain mortgage-backed securities. Investments in emerging markets may be considered speculative and are more likely to experience hyperinflation and currency devaluations, which adversely affect returns. In addition, many emerging securities markets have lower trading volumes and less liquidity.
Stock and bond values fluctuate in price so the value of your investment can go down depending on market conditions. Non-investment-grade debt securities (high-yield/junk bonds) may be subject to greater market fluctuations, risk of default or loss of income and principal than higher rated securities. Asset allocation strategies do not assure profit and do not protect against loss.
Actively managed funds do not seek to replicate the performance of a specified index, may have higher portfolio turnover, and may charge higher fees than index funds due to increased trading and research expenses. There is no guarantee that an active fund will meet its investment objective.
This material is not intended to be relied upon as a forecast, research, or investment advice, and is not a recommendation, offer or solicitation to buy or sell any securities or to adopt any investment strategy. The opinions expressed are as of October 31, 2026, and may change as subsequent conditions vary.
The information and opinions contained in this commentary are derived from proprietary and non-proprietary sources deemed by BlackRock to be reliable, are not necessarily all-inclusive and are not guaranteed as to accuracy. As such, no warranty of accuracy or reliability is given and no responsibility arising in any other way for errors and omissions (including responsibility to any person by reason of negligence) is accepted by BlackRock, its officers, employees, or agents.
This commentary may contain “forward-looking” information that is not purely historical in nature. Such information may include, among other things, projections, and forecasts. There is no guarantee that any forecasts made will come to pass. Reliance upon information in this post is at the sole discretion of the reader.
Any opinions or forecasts represent an assessment of the market environment at a specific time and is not a guarantee of future results. This information should not be relied upon by the reader as research, investment advice or a recommendation. This material does not constitute investment advice and is not intended as an endorsement of any specific investment.
Investment involves risk. Information and opinions are derived from proprietary and non-proprietary sources.
Prepared by BlackRock Investments, LLC, member FINRA.
©2026 BlackRock, Inc. or its affiliates. All rights reserved. BLACKROCK is a trademark of BlackRock, Inc., or its affiliates. All other marks are the property of their respective owners.
FFI1126-MH-6080722-EXP1127
A message from Advisor Perspectives and VettaFi: Discover something new! Click here to register for our upcoming webcasts.
Membership required
Membership is now required to use this feature. To learn more:
View Membership Benefits